
Volume 11, Issue 3 (September 2026)
J Environ Health Sustain Dev 2026, 11(3): 3113-3126 |
Back to browse issues page


Ethics code: IR.GOUMS.REC.1401.084


Download citation:
BibTeX | RIS | EndNote | Medlars | ProCite | Reference Manager | RefWorks
Send citation to:


BibTeX | RIS | EndNote | Medlars | ProCite | Reference Manager | RefWorks
Send citation to:
Rahimzadeh H, Heidari H, Beirami S, Dargahi A, Faraji H, Mokhtarkoureh F, et al . Assessment of PM₁₀ Atmospheric Particle Concentrations and Heavy Metals Levels in the Air of Gorgan City, Iran. J Environ Health Sustain Dev 2026; 11 (3) :3113-3126
URL: http://jehsd.ssu.ac.ir/article-1-1026-en.html
URL: http://jehsd.ssu.ac.ir/article-1-1026-en.html
Hadi Rahimzadeh  , Hamidreza Heidari , Somayeh Beirami , Abdollah Dargahi * , Hossein Faraji , Farnam Mokhtarkoureh , Mohammad Heidari , Fatemeh Piran, Farshad Bahrami Asl
Department of Environmental Health, Khalkhal University of Medical Sciences, Khalkhal, Iran & Social Determinants of Health Research Center, School of Health, Ardabil University of Medical Sciences, Ardabil, Iran
Full-Text [PDF 840 kb]
(92 Downloads)
| Abstract (HTML) (390 Views)
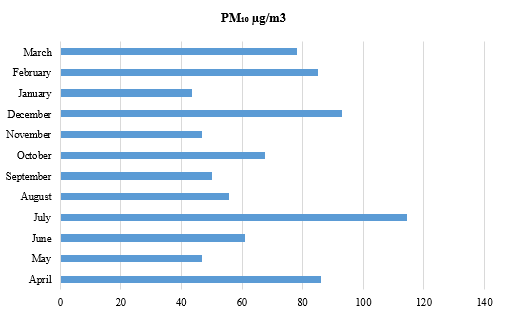
Figure 1: Monthly variations of PM₁₀ concentrations in Gorgan.
Table 1: Summary comparison of PM₁₀ concentrations obtained in the present study with those reported in other studies conducted in Iran and other countries (expressed in µg/m³).
Table 2: Mean and standard deviation of PM₁₀ and heavy metal concentrations by season in Gorgan City.
Table 3: Annual mean concentrations of heavy metals in PM₁₀ (ng/m³).
Table 4: Summary comparison of heavy metal concentrations associated with PM₁₀ obtained in the present study and those reported in other studies conducted in Iran and other countries (ng/m³)..
Table 5: Pearson linear correlation coefficients for heavy metals in PM₁₀ samples.
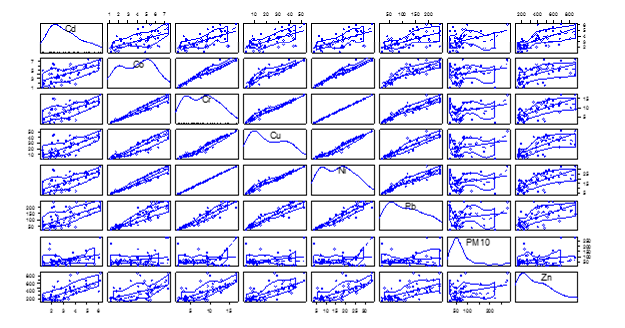
Figure 2: Graphical representation of correlation patterns between PM₁₀ and heavy metals.
Full-Text: (22 Views)
Assessment of PM₁₀ Atmospheric Particle Concentrations and Heavy Metals Levels in the Air of Gorgan City, Iran
Hadi Rahimzadeh 1,2 , Hamidreza Heidari 1,3 , Somayeh Beirami 1,2 , Abdollah Dargahi 4,5* , Hossein
Faraji 6 , Farnam Mokhtarkoureh 7 , Mohammad Heidari 8 , Fatemeh Piran 2 , Farshad Bahrami Asl 9
1 Environmental Health Research Center, Golestan University of Medical Sciences, Gorgan, Iran.
2 Department of Environmental Health Engineering, Faculty of Health, Golestan University of Medical Sciences, Gorgan, Iran.
3 Department of Occupational health, Faculty of Health, Golestan University of Medical Sciences, Gorgan, Iran.
4 Department of Environmental Health, Khalkhal University of Medical Sciences, Khalkhal, Iran.
5 Social Determinants of Health Research Center, School of Health, Ardabil University of Medical Sciences, Ardabil, Iran.
6 Tropical and Communicable Diseases Research Center, Iranshahr University of Medical Sciences, Iranshahr, Iran.
7 Student of the Research Committee, Khalkhal University of Medical Sciences, Khalkhal, Iran.
8 Department of Epidemiology, School of Medicine, Urmia University of Medical Sciences, Urmia, Iran.
9 Department of Environmental Health Engineering, School of Public Health, Urmia University of Medical Sciences, Urmia, Iran.
Hadi Rahimzadeh 1,2
Faraji 6
1 Environmental Health Research Center, Golestan University of Medical Sciences, Gorgan, Iran.
2 Department of Environmental Health Engineering, Faculty of Health, Golestan University of Medical Sciences, Gorgan, Iran.
3 Department of Occupational health, Faculty of Health, Golestan University of Medical Sciences, Gorgan, Iran.
4 Department of Environmental Health, Khalkhal University of Medical Sciences, Khalkhal, Iran.
5 Social Determinants of Health Research Center, School of Health, Ardabil University of Medical Sciences, Ardabil, Iran.
6 Tropical and Communicable Diseases Research Center, Iranshahr University of Medical Sciences, Iranshahr, Iran.
7 Student of the Research Committee, Khalkhal University of Medical Sciences, Khalkhal, Iran.
8 Department of Epidemiology, School of Medicine, Urmia University of Medical Sciences, Urmia, Iran.
9 Department of Environmental Health Engineering, School of Public Health, Urmia University of Medical Sciences, Urmia, Iran.
| A R T I C L E I N F O | ABSTRACT | |
| ORIGINAL ARTICLE | Introduction: With increasing industrialization and urbanization, particulate matter (PM₁₀) has become one of the major air pollutants and a critical concern for environmental and public health. Therefore, this study aimed to assess seasonal/annual variations of PM10-bound heavy metals in Gorgan, compare them with WHO/international data, and identify potential sources via correlation analysis. Methods: cross-sectional experimental study was conducted between March 2023 and March 2024 in Gorgan, Golestan province, Iran. Sampling was performed every six days throughout the study period according to the U.S. Environmental Protection Agency (EPA) method. A total of 52 samples were collected to determine PM₁₀ and heavy metals concentrations. Samples were taken from a central urban station using a BGI Omni FT ambient air sampler. Results: Results showed that PM₁₀ concentrations ranged from a minimum of 20.83 μg/m³ in early November to a maximum of 277.78 μg/m³ in early February, with a mean ± SD of 69.3 ± 49.82 μg/m³ across the study period. Seven trace elements were analyzed, and their annual mean concentrations followed the order: Cd <Co < Cr < Ni < Cu < Pb < Zn. Strong positive correlations were observed among several metals, particularly Cu, Cr, and Ni, with nearly linear relationships. Conclusion: The findings demonstrated that PM₁₀ levels in Gorgan slightly exceeded the WHO 24-hour guideline, with more pronounced fluctuations on a monthly scale. Among the heavy metals, Zn, Pb, and Cu exhibited the highest concentrations, peaking during winter. |
|
Article History: Received: 17 May 2026 Revised: 13 August 2026 Accepted: 20 August 2026 |
||
*Corresponding Author: Abdollah Dargahi Email: a.dargahi29@yahoo.com Tel: +98 914 159 7607 |
||
Keywords: Heavy Metals, PM₁₀, Ambient Air Quality, Seasonal Variation. |
Citation: Rahimzadeh H, Heidari H, Beirami S, et al. Assessment of PM₁₀ Atmospheric Particle Concentrations and Heavy Metals Levels in the Air of Gorgan City, Iran. J Environ Health Sustain Dev. 2026; 11(3): 3113-26.
Introduction
Climate change has been identified by the World Health Organization (WHO) as one of the greatest health threats of the twenty-first century. Alongside this global issue, air pollution remains a major environmental determinant of public health and economic stability in many societies 1. The severity of air pollution is largely associated with the absence of bypass infrastructure, proximity of industrial facilities to residential neighborhoods, and extensive use of fuels with low combustion quality 2, 3. In addition, poor air circulation intensifies the accumulation of hazardous pollutants such as particulate matter (PM), volatile organic compounds (VOCs), nitrogen oxides (NOx), carbon monoxide (CO), heavy metals, and persistent organic pollutants 1.
Particulate matter (PM) is a critical air pollutant that adversely affects environmental integrity and human health 4. PM arises from a range of natural and human-induced sources. Volcanic eruptions, wildfires, dust events, and sea-salt aerosols contribute naturally, while industrial operations, combustion processes, vehicle exhaust, and tobacco smoke are key anthropogenic contributors 5, 6. Based on their size, PM is commonly classified into three major categories: coarse, fine, and ultrafine particles. Exposure to suspended particulate matter (SPM) has been linked to a wide range of short- and long-term health effects, including cardiovascular diseases, pulmonary disorders, eye irritation, headaches, and cancers, ultimately contributing to premature mortality 7. Determining the atmospheric concentration of particles with an aerodynamic diameter ≤ 10 μm (PM₁₀) is crucial not only because of their detrimental health effects but also for developing strategies to reduce air pollution. The toxicity of suspended particles depends on both their size and chemical composition; however, the major health risks are primarily attributed to their chemical constituents 8, 9. Particulate matter (PM) may contain heavy metals such as lead (Pb), cadmium (Cd), nickel (Ni), copper (Cu), chromium (Cr), manganese (Mn), vanadium (V), zinc (Zn), and arsenic (As), all of which pose serious risks to human health. The principal exposure pathways for these contaminants are inhalation, ingestion, and skin contact 4. Major contributors to atmospheric metal contamination include smelting processes, fossil fuel burning, mining activities, and road traffic emissions, with particularly high impacts observed in urban and industrialized areas 10, 11. The environmental persistence of heavy metals constitutes a major concern, as they remain stable for extended periods and bioaccumulate in multiple environmental compartments—air, soil, water, and living tissues. Chronic exposure, even at trace levels, may lead to disturbances in biological functioning 12.
Given the detrimental effects of heavy metals on both human health and ecosystems, numerous investigations have been carried out globally to quantify their environmental levels 9, 13. Arsenic, cadmium, and nickel have been classified by the International Agency for Research on Cancer (IARC) as Group 1 human carcinogens, with established associations with lethal cancers of the lung, trachea, and bronchi 1. Lead has been categorized as a probable human carcinogen (Group 2A) and is known to cause neurological and renal damage 14. Chronic exposure in children has been associated with developmental delays and deficits in learning 15. Elevated airborne copper (Cu), frequently used in industry, is associated with oxidative stress and liver damage 16. In general, exposure to heavy metals may disrupt neurological function, impair renal health, interfere with bone development, and cause damage to various other organs 17, 18. Recently, the European Parliament and Council proposed updated guidelines for ambient air quality and cleaner air in Europe. According to this proposal, the annual limits for PM₁₀ are reduced from 40 µg/m³ to 20 µg/m³, and for PM2.5 from 25 µg/m³ to 10 µg/m³, with the introduction of a new daily limit for PM2.5 19. Risk-based evaluation of toxic metal exposure in indoor and outdoor environments across China revealed that zinc recorded the highest concentrations, whereas lead showed the lowest. Notably, the lifetime cancer risk (LCR) estimates for arsenic and cadmium were above the acceptable limits in specific cities 20. Additionally, a study examining the impact of PM10 on mortality in Bogotá from 1998 to 2006 found that increases in PM10 concentrations were associated with acute respiratory-related deaths 21. More recently, two studies reported that PM10 levels in Santa Marta exceeded the international precautionary threshold of 50 µg/m³ 21. Despite the growing body of research on urban air pollution in Iran, comprehensive data on PM₁₀ and its associated heavy metal content remain scarce for many mid-sized cities, particularly those with distinct climatic and geographical characteristics. Gorgan, the capital of Golestan Province, exemplifies such a city. It features a temperate climate with high humidity in summer and cold winters—conditions that can substantially affect the atmospheric dispersion, transformation, and deposition of particulate-bound pollutants. Moreover, rapid urbanization and increased vehicular traffic in recent years have heightened concerns about local air quality, yet no systematic monitoring or characterization of PM₁₀-bound trace elements has been conducted in this region. This study addresses this critical knowledge gap by providing the first year-round dataset on PM₁₀ and its associated heavy metals (Zn, Cu, Cr, Cd, Pb, Ni, and Co) in Gorgan's urban atmosphere. Accordingly, the specific objectives of this investigation were to: (1) determine the seasonal and annual concentration profiles of PM₁₀ and the selected heavy metals; (2) compare the measured concentrations with World Health Organization (WHO) air quality guidelines and findings from comparable international studies; and (3) evaluate inter-element correlations to identify potential common sources. We hypothesized that heavy metal concentrations would exhibit significant seasonal variations, with peak levels in winter driven by increased fossil fuel combustion, and that strong positive correlations among specific metals would indicate shared anthropogenic emission sources, particularly traffic-related and industrial activities.
Materials and Methods
Study Area
This experimental cross-sectional study was conducted between March 2023 and March 2024 in Gorgan, the capital of Golestan Province, located in northeastern Iran. Gorgan is situated at latitude 36.50°N and longitude 54.26°E, at an altitude of 160 meters above sea level. The city has a temperate climate characterized by hot, humid summers and cold winters. Gorgan comprises three distinct topographical regions: plains, piedmonts, and mountains. The prevailing wind direction is from the west and southwest. According to the most recent census, the population of Gorgan is approximately 500,000 inhabitants.
Sampling and Analytical Procedures
Air sampling was conducted on a weekly basis (once every 7 days) over a 12-month period from March 2023 to March 2024, yielding a total of 52 samples. Samples were collected at a fixed monitoring station located in the city center, using a BGI OMNI FT ambient air sampler operating at a constant flow rate of 5 L/min, in accordance with the U.S. Environmental Protection Agency (EPA) reference method for PM₁₀ 22.
Particulate matter (PM₁₀) was collected on quartz microfilters. Before and after sampling, all filters were conditioned in a desiccator for at least 24 h to eliminate moisture. The filters were weighed using a microbalance with 0.001 mg precision, and PM₁₀ mass concentrations (µg/m³) were calculated gravimetrically based on the difference in filter weights (W₂ – W₁).
For heavy metal analysis, the loaded filters were digested using a mixture of nitric acid and perchloric acid in a 10:1 (v/v) ratio, following NIOSH Method 7300 (23). The digested solutions were filtered and stored in polyethylene bottles under refrigeration (4°C) until analysis. Heavy metal concentrations (Zn, Cu, Cr, Cd, Pb, Ni, and Co) were determined using voltammetry with a 797 VA Computrace polarograph (Metrohm, Switzerland).
Quality control measures included the following: (i) the use of field blanks (one blank per 10 samples) to correct for potential contamination during handling and transport; (ii) pre-baking of quartz filters at 450°C for 4 hours to remove organic impurities; and (iii) calibration of the sampler before each sampling campaign using a certified flow meter. The limit of detection (LOD) and limit of quantification (LOQ) for each heavy metals were calculated as 3 and 10 times the standard deviation of blank measurements, respectively. The LOD values (in ng/m³) were: Zn: 0.5, Cu: 0.2, Cr: 0.1, Cd: 0.05, Pb: 0.3, Ni: 0.15, and Co: 0.08. Concentrations below the LOD were replaced with LOD/√2 for statistical analysis.
Statistical Analysis
Quantitative data are expressed as mean ± standard deviation (mean ± SD). Prior to parametric testing, the normality of data distribution was assessed using the Shapiro–Wilk test. All variables met the normality assumption (p > 0.05), justifying the use of parametric tests. One-way analysis of variance (ANOVA) was used to compare PM₁₀ and heavy metal concentrations across seasons. When ANOVA indicated significant differences (p < 0.05), Tukey's HSD post-hoc test was applied for pairwise comparisons. Pearson correlation coefficients were calculated to evaluate linear relationships between variables. All statistical analyses were performed using STATA version 18 (StataCorp, USA). Graphical visualizations, including correlation matrices and scatterplots, were generated using R software (version 4.2) with the 'ggplot2' package. Statistical significance was set at a two-tailed p-value < 0.05 for all analyses.
Results
PM₁₀ Concentrations
To assess pollution levels and their association with nearby dust sources, the variations in PM₁₀ and heavy metal concentrations in Gorgan were analyzed over a 12-month period. The results showed that PM₁₀ concentrations ranged from a minimum of 20.83 µg/m³ in early November to a maximum of 277.78 µg/m³ in early February, with a mean ± standard deviation of 69.3 ± 49.82 µg/m³ over the study period (Table 1). These values are slightly higher than the World Health Organization’s 24-hour guideline of 50 µg/m³. Seasonal mean concentrations ranged from 65.97 ± 36.72 µg/m³ in spring to 71.58 ± 50.34 µg/m³ in summer, with no statistically significant differences observed between the seasons (p = 0.992) (Table 2). Monthly variations showed the highest concentration in July (114.58 µg/m³) and the lowest in January (43.40 µg/m³) (Figure 1).
Figure 1: Monthly variations of PM₁₀ concentrations in Gorgan.
Table 1: Summary comparison of PM₁₀ concentrations obtained in the present study with those reported in other studies conducted in Iran and other countries (expressed in µg/m³).
Table 2: Mean and standard deviation of PM₁₀ and heavy metal concentrations by season in Gorgan City.
| Season | ||||||
| Spring | Summer | Autumn | Winter | Total | Test | |
| PM10 | 65.972 (36.721) | 71.581 (50.348) | 71.047 (41.778) | 68.866 (73.818) | 69.311 (50.312) | 0.992 |
| Zn | 226.714 (75.242) | 277.385 (108.586) | 461.538 (223.071) | 541.500 (96.514) | 370.731 (186.583) | < 0.001 |
| Cu | 13.532 (5.625) | 7.507 (2.668) | 27.999 (8.825) | 40.082 (5.227) | 21.769 (13.901) | < 0.001 |
| Cd | 2.529 (0.823) | 2.438 (0.747) | 3.500 (0.998) | 4.300 (1.437) | 3.158 (1.250) | < 0.001 |
| Pb | 82.286 (33.160) | 56.000 (26.331) | 157.846 (54.714) | 178.667 (39.204) | 116.846 (63.864) | < 0.001 |
| Cr | 6.720 (2.374) | 4.046 (1.911) | 9.359 (2.675) | 13.009 (1.755) | 8.162 (3.928) | < 0.001 |
| Co | 3.953 (1.397) | 2.333 (1.147) | 4.417 (1.099) | 5.955 (0.844) | 4.126 (1.697) | < 0.001 |
| Ni | 13.439 (4.748) | 8.091 (3.822) | 18.718 (5.349) | 26.019 (3.511) | 16.325 (7.856) | < 0.001 |
Heavy Metal Concentrations
Analysis of seven trace elements in ambient air samples yielded their annual mean concentrations, as shown in Table 3, with comparative data from other studies presented in Table 4. The mean concentrations followed the order: Cd (3.2 ± 1.23 ng/m³) < Co (4.1 ± 1.68) < Cr (8.2 ± 3.88) < Ni (16.3 ± 7.77) < Cu (21.8 ± 13.76) < Pb (116.8 ± 63.24) < Zn (370.7 ± 184.78). All metals exhibited considerable seasonal variations, with statistically significant differences (p < 0.001). Zinc (Zn) showed a continuous increasing trend from spring (226.7 ng/m³) to winter (541.5 ng/m³). For the other metals, the minimum concentrations were observed in summer, while the maximum concentrations were observed in winter. The ratio of seasonal variations (minimum/maximum) ranged from 1.76 for Cd to 5.34 for Cu, indicating a marked increase in metal concentrations during winter (Table 2).
Analysis of seven trace elements in ambient air samples yielded their annual mean concentrations, as shown in Table 3, with comparative data from other studies presented in Table 4. The mean concentrations followed the order: Cd (3.2 ± 1.23 ng/m³) < Co (4.1 ± 1.68) < Cr (8.2 ± 3.88) < Ni (16.3 ± 7.77) < Cu (21.8 ± 13.76) < Pb (116.8 ± 63.24) < Zn (370.7 ± 184.78). All metals exhibited considerable seasonal variations, with statistically significant differences (p < 0.001). Zinc (Zn) showed a continuous increasing trend from spring (226.7 ng/m³) to winter (541.5 ng/m³). For the other metals, the minimum concentrations were observed in summer, while the maximum concentrations were observed in winter. The ratio of seasonal variations (minimum/maximum) ranged from 1.76 for Cd to 5.34 for Cu, indicating a marked increase in metal concentrations during winter (Table 2).
Table 3: Annual mean concentrations of heavy metals in PM₁₀ (ng/m³).
| Zn | Cu | Cd | Pb | Cr | Co | Ni | |
| mean | 370.7 ± 184.78 | 21.8 ± 13.76 | 3.2 ± 1.23 | 116.8 ± 63.24 | 8.2 ± 3.88 | 4.1 ± 1.68 | 16.3 ± 7.77 |
| min | 150.0 | 2.8 | 1.2 | 24.0 | 1.9 | 1.1 | 3.7 |
| max | 870.0 | 51.7 | 6.1 | 240.0 | 16.7 | 7.4 | 33.3 |
Table 4: Summary comparison of heavy metal concentrations associated with PM₁₀ obtained in the present study and those reported in other studies conducted in Iran and other countries (ng/m³)..
| Ref | Duration | Zn | Cu | Cd | Pb | Cr | Co | Ni | Location | ||
| Shahsavani et al. 2025 20 |
summer of 2019 | 33.08 | 102.04 | _ | 17.61 | _ | _ | 82.15 | Iran (Shiraz) | ||
| Alharbi et al. 202426 |
April–December2023 | 9.06 | 10.97 | 0.04 | 1.11 | 3.75 | 0.25 | 1.72 | Saudi Arabia (Riyadh) | ||
| Lara et al. 202328 |
May 2019 to September 2020 | 9.4 | 9.2 | 0.19 | 9.4 | 3.2 | 0.21 | 1.7 | Spain (Gijon) | ||
| Karimi et al. 202343 |
2021 autumn | 29.21 | _ | _ | 6/81 | 29/55 | _ | _ | Iran (Tehran) | ||
| Esform et al. 202230 |
September 2019 to March 2020 | 0.71 | 0.006 | 9.588 | 0.004 | 0.006 | 0.224 | 0.006 | Iran (Birjand) | ||
| Rezayani et al. 202244 |
April 2019 to March 2020 | 106.21 | 16.377 | 5.357 | 31.65 | 5.615 | _ | 5.77 | Iran (Tehran) | ||
| Karimi et al. 202245 |
2021 spring | 18.78 | _ | _ | 0/17 | 25/42 | _ | _ | Iran (Tehran) | ||
| Karimi et al. 202246 |
2021 | 23.99 | _ | _ | Mar-49 | 27 /48 | _ | _ | Iran (Tehran) | ||
| Joshirvani et al. 202147 |
May to November 2017 | _ | 1.78 | 7.44 | 2.72 | _ | _ | Iran (Hamadan) | |||
| Shahid et al. 201837 |
March and April of 2010 | 830 | 420 | _ | 410 | 50 | _ | 20 | Iran (Birjand) | ||
| Farsani et al. 201838 |
October 2012 to September 2013 | Iran (Ahvaz) | |||||||||
| normal days | autumn | 2.8 | _ | 0.19 | 2.85 | 0.39 | 0.3 | 0.61 | |||
| winter | 7.95 | _ | 0.22 | 5.7 | 1.05 | 0.85 | 1.58 | ||||
| spring | 3.48 | _ | 0.25 | 3.5 | 0.8 | 0.43 | 1.3 | ||||
| summer | 2.89 | _ | 0.2 | 3.1 | 0.66 | 0.35 | 1.1 | ||||
| Duststorm | autumn | 4.02 | _ | 0.51 | 3.67 | 1.55 | 1.45 | 1.79 | |||
| winter | 8.23 | _ | 0.87 | 5.78 | 1.8 | 1.58 | 2.35 | ||||
| spring | 4.3 | _ | 0.48 | 4.4 | 1.4 | 0.66 | 2.1 | ||||
| summer | 3.45 | _ | 0.59 | 3.66 | 1 | 0.72 | 1.5 | ||||
| Di Vaio et al. 201839 |
February 2013- October 2013 | Italy (Acerra) | |||||||||
| autumn | 75.1 | 23.4 | 4.35 | 60.8 | 14.7 | 1.6 | 17.9 | ||||
| winter | 76.6 | 17.3 | 4.77 | 50.6 | 19.7 | 3.8 | 16.7 | ||||
| spring | 79.4 | 24.1 | 4.26 | 55.8 | 14.2 | 2.1 | 11 | ||||
| summer | 45.7 | 19.2 | 3.8 | 59.9 | 14 | 2.52 | 10.2 | ||||
| Dai et al. 201548 |
February 2011 to January 2012 | 1018.6 | 154 | 4 | 195.2 | 19.2 | 2.4 | 10.7 | iron and steel industry zone | China | |
| 794.6 | 117.1 | 3.8 | 158.7 | 7.5 | 1.1 | 6.2 | background site | ||||
Correlation Analysis
Table 5 presents the correlation coefficients between PM₁₀ and the heavy metals. Cd exhibited the strongest correlation with PM₁₀ (r = 0.401, p = 0.002). The correlation for Zn (r = 0.263, p = 0.050) was at the borderline of statistical significance, whereas the correlation for Cu (r = 0.246, p = 0.068) was not statistically significant. Pb, Cr, Co, and Ni exhibited positive but non-significant correlations with PM₁₀. In the correlation analysis among the metals, very strong and statistically significant relationships were observed between the metals. Cu showed the highest correlation with Pb, Cr, Co, and Ni. Pb exhibited strong correlations with Cr and Co. The correlation of Cr with Co and Ni was also very high. Cd showed very strong and significant correlations with Zn, Cu, Pb, Cr, Co, and Ni. These results are clearly illustrated in Figure 2.
Table 5 presents the correlation coefficients between PM₁₀ and the heavy metals. Cd exhibited the strongest correlation with PM₁₀ (r = 0.401, p = 0.002). The correlation for Zn (r = 0.263, p = 0.050) was at the borderline of statistical significance, whereas the correlation for Cu (r = 0.246, p = 0.068) was not statistically significant. Pb, Cr, Co, and Ni exhibited positive but non-significant correlations with PM₁₀. In the correlation analysis among the metals, very strong and statistically significant relationships were observed between the metals. Cu showed the highest correlation with Pb, Cr, Co, and Ni. Pb exhibited strong correlations with Cr and Co. The correlation of Cr with Co and Ni was also very high. Cd showed very strong and significant correlations with Zn, Cu, Pb, Cr, Co, and Ni. These results are clearly illustrated in Figure 2.
Table 5: Pearson linear correlation coefficients for heavy metals in PM₁₀ samples.
| Variables | (1) | (2) | (3) | (4) | (5) | (6) | (7) | (8) |
| (1) PM10 | 1.000 | |||||||
| (2) Zn | 0.263 | 1.000 | ||||||
| (0.050) | ||||||||
| (3) Cu | 0.246 | 0.709 | 1.000 | |||||
| (0.068) | (< 0.001) | |||||||
| (4) Cd | 0.401 | 0.674 | 0.662 | 1.000 | ||||
| (0.002) | ( < 0.001) | ( < 0.001) | ||||||
| (5) Pb | 0.166 | 0.621 | 0.928 | 0.605 | 1.000 | |||
| (0.221) | ( < 0.001) | ( < 0.001) | ( < 0.001) | |||||
| (6) Cr | 0.249 | 0.658 | 0.968 | 0.622 | 0.928 | 1.000 | ||
| (0.064) | ( < 0.001) | ( < 0.001) | ( < 0.001) | ( < 0.001) | ||||
| (7) Co | 0.223 | 0.516 | 0.879 | 0.563 | 0.849 | 0.953 | 1.000 | |
| (0.099) | ( < 0.001) | ( < 0.001) | ( < 0.001) | ( < 0.001) | ( < 0.001) | |||
| (8) Ni | 0.249 | 0.658 | 0.968 | 0.622 | 0.928 | 1.000 | 0.953 | 1.000 |
| (0.064) | ( < 0.001) | ( < 0.001) | ( < 0.001) | ( < 0.001) | ( < 0.001) | ( < 0.001) |
Figure 2: Graphical representation of correlation patterns between PM₁₀ and heavy metals.
Comparison with International Studies
The average PM₁₀ and heavy metal concentrations in our study, along with the findings of other studies, are presented in Tables 1 and 4. The mean PM₁₀ concentration in Gorgan (69.3 µg/m³) was lower than the values reported for Ahvaz (223.4 µg/m³) (26), Riyadh (223.1 µg/m³) (27), and industrial sites in Senegal (232.3 µg/m³) (4), but higher than those for Gijon, Spain (31 µg/m³) (29), Lamphun, Thailand (43.0 µg/m³) (35), and Makkah (44.5 µg/m³) (41). The annual concentrations of Zn, Pb, and Cu were lower than the concentrations reported by Dai (2015) in China but considerably higher than those reported by Lara et al. (2023) in Spain and Rezayani et al. (2022) in Tehran. The mean concentrations of Ni and Co were higher than the values reported in Tehran, Spain, and China (29, 44). The mean concentration of Cd was lower than the values reported for Tehran and China but higher than those reported in Spain. The mean concentration of Cr was higher than the levels reported in Spain and Tehran but lower than those in industrial regions of China.
Discussion
Variations of PM₁₀ Concentration
Results showed that PM₁₀ concentrations ranged from a minimum of 20.83 µg/m³ in early November to a maximum of 277.78 µg/m³ in early February, with a mean ± standard deviation of 69.3 ± 49.82 µg/m³ over the study period (Table 1). These values are slightly higher than the World Health Organization’s 24-hour guideline of 50 µg/m³. In the study conducted by Hamidi et al. (2025)25, which investigated PM₁₀ over an 11-year period (2008–2019) in Ahvaz, the mean concentration was reported as 223.4 µg/m³. Similarly, in a study by Kebe et al. (2025)4 in Senegal, the PM₁₀ concentrations were estimated at 232.318 and 209.854 µg/m³ at industrial and urban–coastal sites, respectively. Furthermore, Adly et al. (2025)24, in a five-year study (2020–2024) in Makkah, observed an increasing trend in PM₁₀ concentrations, which rose from 127.7 µg/m³ in 2020 to 138.3 µg/m³ in 2024. Overall, the annual mean concentrations reported in all these studies are higher than those in the present investigation. Research conducted in Ahvaz and Senegal demonstrated the substantial impact of natural sources on air pollution, whereas in Makkah, the observed rise in particulate matter concentrations was primarily linked to anthropogenic activities, including population growth, traffic emissions, and construction operations. In contrast, other studies conducted by Lara et al. (2023)28 in Spain, Kliengchuay et al. (2021) 34 in Thailand, and Munir et al. (2017) 40 in Makkah reported PM₁₀ concentrations of 31, 42.98, and 44.53 µg/m³, respectively. The observed values were not only less than those recorded in this study but also below the World Health Organization’s 24-hour guideline of 50 µg/m³. This discrepancy may reflect the varying influence of different factors, such as local meteorological conditions, emission sources, climatic parameters, policy measures, or operational programs, on PM₁₀ concentrations across different locations.
Shahsavani et al. (2025)20 conducted a study in Fars province focusing on the summer season and reported a PM₁₀ concentration of 78.12 µg/m³. Elevated summer concentrations were attributed to the large amounts of suspended particles entering the atmosphere due to the desiccation of extensive areas of Bakhtegan Lake, transported by winds. In another investigation, Ahmad et al. (2023)29 carried out a winter study in Pakistan and reported a PM₁₀ concentration of 279.73 µg/m³, which they linked to stagnant climatic conditions. Furthermore, Farsani et al. (2018)38 examined the relationship between PM₁₀ levels on normal days and dust storm days in Ahvaz. They found that the lowest PM₁₀ concentrations on both normal and dust storm days occurred in summer (127 and 278 µg/m³, respectively), while the highest concentrations were observed in winter (189 and 742 µg/m³, respectively). Elevated PM₁₀ concentrations, particularly in winter, may be associated with the combustion of fossil fuels, coal, and wood. Conversely, lower concentrations in autumn and summer could be due to reduced human activities and the less frequent occurrence of dust storms during these seasons.
Metals Associated with PM₁₀
The mean concentrations of zinc (Zn) and lead (Pb) across all seasons exceeded the values documented in studies conducted in Fars, Tehran, Ahvaz, and Italy20, 43, 45, 46. In contrast, the seasonal mean concentration of copper (Cu) was lower than the levels reported by Shahsavani et al. (2025)20 and Di Vaio et al. (2018)39. The mean concentration of cadmium (Cd) was also below the values reported by Di Vaio et al. (2018)39 and Farsani et al. (2018)38. Conversely, for cobalt (Co), the seasonal mean in the present study was higher than in these two studies. Overall, the differences reported can be attributed to variations in the sources of these compounds and the types of sampling locations. The substantial increase in metal concentrations during winter may be due to colder conditions, increased consumption of fossil fuels, and reduced precipitation. Human activities, such as industrial operations and traffic, play a significant role in the dispersion of heavy metals. The sources of heavy metals vary; for example:
• Nickel (Ni) originates from traffic emissions, industrial activities, gas refinerie, and fuel combustion49-51.
• Copper (Cu) is associated with high-temperature processe, such as residential boilers and automobiles49, 52.
• Lead (Pb) is primarily derived from tire wear,vehicle component corrosions, and lubricants53.
• Chromium (Cr) mainlyoriginatess from agricultural activities, industrial operations, tire degradation, and greenhouse gas emissions54, 55.
Consequently, heavy metals in urban air are diverse, complex, and strongly influenced by environmental conditions and seasonal variations.
Inter-Metal Correlations and Source Implications
In the correlation analysis of the metals, very strong and statistically significant relationships were observed. Positive correlations among many metals, particularly between Cu, Cr, and Ni, exhibited a very strong linear pattern with correlations approaching one. The scatter of data between PM₁₀ and Cd was more pronounced compared to other metals, indicating a significant relationship. These observations are fully consistent with the results presented in Table 4. In the study by Alharbi et al. (2024)26, no significant positive correlation was observed for Cd, which differs from the observations of the current study. Similarly, the correlation results reported by Esform et al. (2022)30 showed a significant relationship between PM₁₀ and Co, Cu, and Cr (P < 0.05), which does not align with our findings. In the Alharbi et al. (2024)26 study, the correlation between Pb and Cd was significant, consistent with the present study; however, the correlation between Cu and Cd in their study was not positive, whereas in the present study this relationship was very strong and significant. The relationship between chromium (Cr) and nickel (Ni) was very strong and significant, which is consistent with findings from the Nanjing–Shanghai highway 30. In the studies by Motesaddi Zarandi et al. (2019) and Esform et al. (2022), no significant correlation was observed between Pb and Cr, which does not match the results of the present study56. Overall, the observed high positive correlations indicate significant interrelationships among the elemental constituents of PM₁₀ during the sampling period, offering a clearer perspective on their likely origins and atmospheric interactions. Furthermore, the strong correlations observed between Cu, Cr, Ni, and Pb indicate the likely presence of a common source, particularly industrial and traffic-related activities (Figure 2).
Conclusion
The findings of this study reveal that, over the study period, PM ₁₀ levels in Gorgan were generally slightly above the 24-hour guideline established by the World Health Organization. Observed variations in pollutant concentrations were less influenced by seasonal changes; however, on a monthly scale, a relatively clear pattern was observed, with the highest concentrations in summer and the lowest in winter. Comparison with similar studies in other regions of the world suggests that climatic differences, local meteorological conditions, natural dust sources, and human activities can play a determining role in the levels of air pollution.
Regarding heavy metals associated with PM₁₀, the results showed that zinc (Zn), lead (Pb), and copper (Cu) exhibited the highest concentrations in the samples, typically reaching their peak levels in winter. This increasing trend can be attributed to cold weather conditions, increased fossil fuel consumption, and reduced precipitation. Additionally, strong correlations among certain metals, including Cu, Cr, Ni, and Pb, indicate the presence of common sources, particularly traffic and industrial activities.
Acknowledgments
This study is part of a research project approved by Golestan University of Medical Sciences (Project Code: 112630, IR.GOUMS.REC.1401.084). The authors express their sincere gratitude to the Vice-Chancellor for Research and Technology for their support and assistance.
Funding
This study was financially supported by Golestan University of Medical Sciences (Project Code: 112630, IR.GOUMS.REC.1401.084).
Ethical Considerations
Golestan University of Medical Sciences (IR.GOUMS.REC.1401.084).
Code of Ethics
IR.GOUMS.REC.1401.084
Ethics approval and consent to participate
Not applicable.
Consent for publication
Not applicable.
Availability of data and material
Not applicable.
Competing interests
The authors declare no conflicts of interest.
Author contributions
These authors contributed equally to this work and share first authorship.
This is an Open-Access article distributed in accordance with the terms of the Creative Commons Attribution (CC BY 4.0) license, which permits others to distribute, remix, adapt, and build upon this work for commercial use.
References
1. Kozielska B, Kaleta D. Cancer risk associated with inhalation exposure to PM10-Bound PAHs and PM10-Bound heavy metals in Polish Agglomerations. Appl Sci (Basel). 2025;15(14):7903.
2. Barreira LM, Lepistö T, Salo L, et al. Comprehensive characterization of wintertime submicron aerosol in a Nordic town influenced by residential wood combustion, traffic and industrial sources. Atmos Pollut Res. 2023;14(8):101835.
3. Maceira A, Borrull F, Marcé RM. Occurrence of organic contaminants bonded to the particulate matter from outdoor air influenced by industrial activities. Environ Sci Pollut Res Int. 2022;29(51):76644-67.
4. Kebe M, Traore A, Sow M, et al. Human health risk evaluation of particle air pollution (PM10 and PM2.5) and heavy metals in Dakar's two urban areas. Asian Journal of Atmospheric Environment. 2025;19(1):7.
5. Faraji Ghasemi F, Dobaradaran S, Saeedi R, et al. Levels and ecological and health risk assessment of PM2.5-bound heavy metals in the northern part of the Persian Gulf. Environ Sci Pollut Res Int. 2020;27(5):5305-13.
6. Kelly FJ, Fussell JC. Toxicity of airborne particles—established evidence, knowledge gaps and emerging areas of importance. Philosophical Transactions of the Royal Society A. 2020;378(2183):20190322.
7. Jaafari J, Naddafi K, Yunesian M, et al. Associations between short term exposure to ambient particulate matter from dust storm and anthropogenic sources and inflammatory biomarkers in healthy young adults. Sci Total Environ. 2021;761:144503.
8. Kumar RP, Prakash A, Singh R, et al. Machine learning-based prediction of hazards fine PM2.5 concentrations: a case study of Delhi, India. Discov Geosci. 2024;2(1):34.
9. Sinha S, Kumar R, Kumar AR, et al. Elemental characteristics of respirable particulate matter in the urban atmosphere of Dehradun, Uttrakhand, India. Curr World Environ. 2021;16(1):319-28.
10. Zhang H, Li R, Huang C, et al. Seasonal variation of aerosol iron solubility in coarse and fine particles at an inland city in northwestern China. Atmos Chem Phys. 2023;23(6):3543-59.
11. Niu S, Song X, Yu J, et al. Particle size dependent heavy metals in road dusts from Maanshan City, China. KSCE Journal of Civil Engineering. 2020;24(5):1411-23.
12. Whaley CH, Galarneau E, Makar PA, et al. How much does traffic contribute to benzene and polycyclic aromatic hydrocarbon air pollution? Results from a high-resolution North American air quality model centred on Toronto, Canada. Atmos Chem Phys. 2020;20(5):2911-25.
13. Kumar RP, Kashyap P, Kumar R, et al. Cancer and non-cancer health risk assessment associated with exposure to non-methane hydrocarbons among roadside vendors in Delhi, India. Human and Ecological Risk Assessment: An International Journal. 2020;26(5):1285-99.
14. Vithanage M, Bandara PC, Novo LA, et al. Deposition of trace metals associated with atmospheric particulate matter: environmental fate and health risk assessment. Chemosphere. 2022;303:135051.
15. Swaringen BF, Gawlik E, Kamenov GD, et al. Children's exposure to environmental lead: a review of potential sources, blood levels, and methods used to reduce exposure. Environ Res. 2022;204:112025.
16. Al-Lambarki M, Hasan H. Assessment of the heavy metal contents in air samples collected from the area extended between Albayda and Alquba cities (Libya). AlQalam Journal of Medical and Applied Sciences. 2025:695-707.
17. Ghosh B, Padhy PK, Niyogi S, et al. A comparative study of heavy metal pollution in ambient air and the health risks assessment in industrial, urban and semi-urban areas of West Bengal, India: an evaluation of carcinogenic, non-carcinogenic, and additional lifetime cancer cases. Environments. 2023;10(11):190.
18. Balali-Mood M, Naseri K, Tahergorabi Z, et al. Toxic mechanisms of five heavy metals: mercury, lead, chromium, cadmium, and arsenic. Front Pharmacol. 2021;12:643972.
19. Commission E. Proposal for a Directive of the European Parliament and of the Council on Ambient Air Quality and Cleaner Air for Europe. Document 52022PC0542. 2022.
20. Shahsavani S, Shamsedini N, Mohammadpour A, et al. Air quality near Middle East's large dried lake: heavy metal emissions, machine learning analysis, and health risks. Physics and Chemistry of the Earth, Parts A/B/C. 2025;137:103793.
21. Vergara-Vásquez E, Beleño LMH, Castrillo-Borja TT, et al. Airborne particulate matter integral assessment in Magdalena department, Colombia: patterns, health impact, and policy management. Heliyon. 2024;10(16).
22. SPM PM. Sampling of ambient air for total Suspended Particulate Matter (SPM) and PM10 using High Volume (HV) sampler. Center for Environmental Research Information Office of Research and Development. 1999.
23. Aldeen SAE, Fleeh NAR. Investigating the air quality index inside two museums in Baghdad City. Iraqi Journal of Science. 2025: 2311-20.
24. Adly HM, Saleh SA. Long-term trends in PM10, PM2.5, and trace elements in ambient air: environmental and health risks from 2020 to 2024. Atmosphere. 2025;16(4):415.
25. Hamidi M, Ghobadi T, Shao Y, et al. Investigation of the role of southwestern Asia dust events on urban air pollution: a case study of Ahvaz, a highly polluted city. Sci Rep. 2025;15(1):21981.
26. Alharbi HA, Rushdi AI, Bazeyad A, et al. Temporal variations, air quality, heavy metal concentrations, and environmental and health impacts of atmospheric PM2.5 and PM10 in Riyadh City, Saudi Arabia. Atmosphere. 2024;15(12):1448.
27. Zeb B, Ditta A, Alam K, et al. Wintertime investigation of PM10 concentrations, sources, and relationship with different meteorological parameters. Sci Rep. 2024;14(1):154.
28. Lara R, van Drooge BL, Canals-Angerri A, et al. Key factors for abating particulate matter in a highly industrialized area in N Spain: fugitive emissions and secondary aerosol precursors. Chemosphere. 2023;341:139959.
29. Ahmad S, Zeb B, Ditta A, et al. Morphological, mineralogical, and biochemical characteristics of particulate matter in three size fractions (PM10, PM2.5, and PM1) in the urban environment. ACS Omega. 2023;8(35):31661-74.
30. Esform A, Hassanvand MS, Naghizadeh A, et al. On the nature of heavy metals in particulate matter (PM10, PM2.5) and their health impact assessment for a desert city in Iran, Birjand. Journal of Air Pollution and Health. 2022.
31. Zeb B, Alam K, Ditta A, et al. Variation in coarse particulate matter (PM10) and its characterization at multiple locations in the Semiarid Region. Front Environ Sci. 2022;10:843582.
32. Sirithian D, Thanatrakolsri P. Relationships between meteorological and particulate matter concentrations (PM2.5 and PM10) during the haze period in urban and rural areas, Northern Thailand. Air, Soil and Water Research. 2022;15:11786221221117264.
33. Usman F, Zeb B, Alam K, et al. In-depth analysis of physicochemical properties of particulate matter (PM10, PM2.5 and PM1) and its characterization through FTIR, XRD and SEM–EDX Techniques in the Foothills of the Hindu Kush Region of Northern Pakistan. Atmosphere. 2022;13(1):124.
34. Kliengchuay W, Worakhunpiset S, Limpanont Y, et al. Influence of the meteorological conditions and some pollutants on PM10 concentrations in Lamphun, Thailand. J Environ Health Sci Eng. 2021;19(1):237-49.
35. Liu B, Sun X, Zhang J, et al. Characterization and spatial source apportionments of ambient PM10 and PM2.5 during the heating period in Tian’jin, China. Aerosol Air Qual Res. 2020;20(1):1-13.
36. Gupta A, Moniruzzaman M, Hande A, et al. Estimation of particulate matter (PM2.5, PM10) concentration and its variation over urban sites in Bangladesh. SN Appl Sci. 2020;2(12):1993.
37. Shahid I, Alvi MU, Shahid MZ, et al. Source apportionment of PM10 at an urban site of a south Asian mega city. Aerosol Air Qual Res. 2018;18(9):2498-509.
38. Farsani MH, Shirmardi M, Alavi N, et al. Evaluation of the relationship between PM10 concentrations and heavy metals during normal and dusty days in Ahvaz, Iran. Aeolian Res. 2018;33:12-22.
39. Di Vaio P, Magli E, Caliendo G, et al. Heavy metals size distribution in PM10 and environmental-sanitary risk analysis in Acerra (Italy). Atmosphere. 2018;9(2):58.
40. Munir S, Habeebullah TM, Mohammed AM, et al. Analysing PM2.5 and its association with PM10 and meteorology in the arid climate of Makkah, Saudi Arabia. Aerosol Air Qual Res. 2017;17(2):453-64.
41. Alam K, Azam M, Shahid I, et al. Source apportionment and characterization of particulate matter (PM10) in urban environment of Lahore. Aerosol Air Qual Res. 2014;14(7):1851-61.
42. Sharma S, Mandal T, Saxena M, et al. Source apportionment of PM10 by using positive matrix factorization at an urban site of Delhi, India. Urban Clim. 2014;10:656-70.
43. karimi sr. The amount of suspended particles containing heavy metals in the air of the 21st district of Tehran, 2021 autumn. Iranian Journal of Biological Sciences. 2023;4(17):61-76.
44. Rezayani N, Mir Mohammadi M, Mehrdadi N. Determination of selected heavy metals in air samples and human health risk assessment in Tehran city, Iran. Iranian Journal of Chemistry and Chemical Engineering. 2022;41(8).
45. Karimi SR, Mansouri N, Taghavi L, et al. Investigation of heavy metal concentrations in airborne particles in district 21 of Tehran. Journal of Research in Environmental Health. 2022;8(2):136-47.
46. Karimi SR, Mansouri N, Taghavi L, et al. The receptor of heavy metals in total particulate matter with UNMIX determine the contribution model in 21st district of Tehran. 2022.
47. Joshirvani A, Samarghandi MR, Leili M. PM10 concentration, its potentially toxic metals content, and human health risk assessment in Hamadan, Iran. Clean (Weinh). 2021;49(6):2000174.
48. Dai Q-L, Bi X-H, Wu J-H, et al. Characterization and source identification of heavy metals in ambient PM10 and PM2.5 in an integrated iron and steel industry zone compared with a background site. Aerosol Air Qual Res. 2015;15(3):875-87.
49. Bi C, Chen Y, Zhao Z, et al. Characteristics, sources and health risks of toxic species (PCDD/Fs, PAHs and heavy metals) in PM2.5 during fall and winter in an industrial area. Chemosphere. 2020;238:124620.
50. Jiang N, Liu X, Wang S, et al. Pollution characterization, source identification, and health risks of atmospheric-particle-bound heavy metals in PM10 and PM2.5 at multiple sites in an emerging megacity in the central region of China. Aerosol Air Qual Res. 2019;19(2):247-71.
51. Nargis A, Habib A, Islam MN, et al. Source identification, contamination status and health risk assessment of heavy metals from road dusts in Dhaka, Bangladesh. Journal of Environmental Sciences. 2022;121:159-74.
52. Kamani H, Hoseini M, Safari GH, et al. Study of trace elements in wet atmospheric precipitation in Tehran, Iran. Environ Monit Assess. 2014;186(8):5059-67.
53. Hou S, Zheng N, Tang L, et al. Pollution characteristics, sources, and health risk assessment of human exposure to Cu, Zn, Cd and Pb pollution in urban street dust across China between 2009 and 2018. Environ Int. 2019;128:430-7.
54. Jiang Y, Ma J, Ruan X, et al. Compound health risk assessment of cumulative heavy metal exposure: a case study of a village near a battery factory in Henan Province, China. Environ Sci Process Impacts. 2020;22(6):1408-22.
55. Cheng X, Huang Y, Zhang S-P, et al. Characteristics, sources, and health risk assessment of trace elements in PM10 at an urban site in Chengdu, Southwest China. Aerosol Air Qual Res. 2018;18(2):357-70.
56. Motesaddi Zarandi S, Shahsavani A, Khodagholi F, et al. Concentration, sources and human health risk of heavy metals and polycyclic aromatic hydrocarbons bound PM2.5 ambient air, Tehran, Iran. Environ Geochem Health. 2019;41(3):1473-87.
Type of Study: Original articles |
Subject:
Air and waste management
Received: 2026/05/17 | Accepted: 2026/08/20 | Published: 2026/09/10
Received: 2026/05/17 | Accepted: 2026/08/20 | Published: 2026/09/10
Send email to the article author
| Rights and permissions | |
 |
This work is licensed under a Creative Commons Attribution-NonCommercial 4.0 International License. |