

Volume 10, Issue 4 (December 2025)
J Environ Health Sustain Dev 2025, 10(4): 2870-2877 |
Back to browse issues page


Ethics code: IR.Khoy.REC.1403.039
Download citation:
BibTeX | RIS | EndNote | Medlars | ProCite | Reference Manager | RefWorks
Send citation to:


BibTeX | RIS | EndNote | Medlars | ProCite | Reference Manager | RefWorks
Send citation to:
Sheikhmohammadi A, Mohammadi A, Atafar Z, Shakuri A, Rasoulzadeh S, Aghanaghad M. Health Risk Assessment of Exposure to SO2 and NO2 Resulting from Power Plant Fuel Change Using Monte Carlo Simulation. J Environ Health Sustain Dev 2025; 10 (4) :2870-2877
URL: http://jehsd.ssu.ac.ir/article-1-976-en.html
URL: http://jehsd.ssu.ac.ir/article-1-976-en.html
Amir Sheikhmohammadi 

 , Amir Mohammadi , Zahra Atafar , Ahmad Shakuri , Shiva Rasoulzadeh , Mohammad Aghanaghad *
, Amir Mohammadi , Zahra Atafar , Ahmad Shakuri , Shiva Rasoulzadeh , Mohammad Aghanaghad *
Department of Environmental Health Engineering, School of Health, Khoy University of Medical Sciences, Khoy, Iran
Full-Text [PDF 383 kb]
(91 Downloads)
| Abstract (HTML) (282 Views)
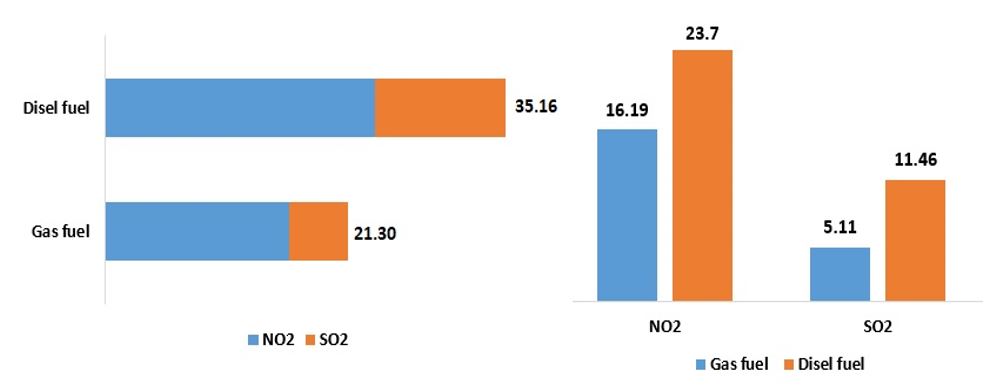
Figure 1: Concentration of pollutants detected in the power plant area affected by different fuels (µg/m3); the horizontal graph shows the total concentration, and the vertical graph shows the individual pollutant concentrations.
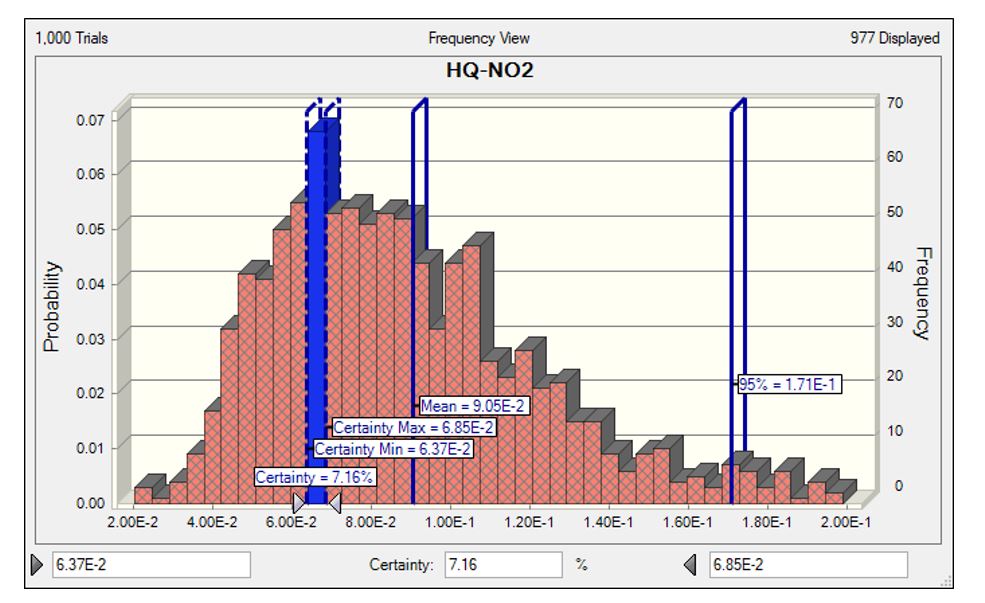
Figure 2: Calculated HQ associated with NO2 exposure by Monte Carlo simulation.
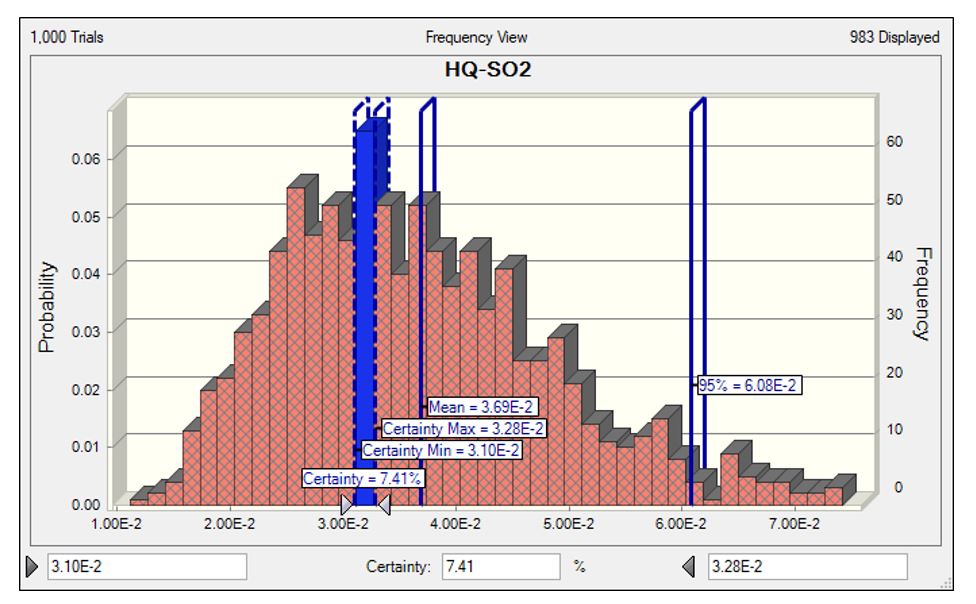
Figure 3: Calculated HQ associated with SO2 exposure using Monte Carlo simulation.
Full-Text: (67 Views)
Health Risk Assessment of Exposure to SO2 and NO2 Resulting from Power Plant Fuel Change Using Monte Carlo Simulation
Amir Sheikhmohammadi 1, Amir Mohammadi 2, Zahra Atafar 3, Ahmad Shakuri 4, Shiva Rasoulzadeh 5, Mohammad Aghanaghad 1*
1 Department of Environmental Health Engineering, School of Health, Khoy University of Medical Sciences, Khoy, Iran.
2 Social Determinants of Health Research Center, Clinical Research Institute, Urmia University of Medical Sciences, Urmia, Iran.
3 Research Center for Environmental Determinants of Health (RCEDH), Health Institute, Kermanshah University of Medical Sciences, Kermanshah, Iran.
4 West Azarbaijan Power Generation Management Company, HSE Responsible Expert of the Company, Urmia, Iran.
5 Student Research Committee, Khoy University of Medical Sciences, Khoy, Iran.
| A R T I C L E I N F O | ABSTRACT | |
| ORIGINAL ARTICLE | Introduction: Exposure to air pollutants is a serious concern that leads to numerous health issues. Power plants are one of the main sources of pollutant emissions, including sulfur dioxide and nitrogen dioxide. This study aimed to estimate the non-carcinogenic risk associated with exposure to SO2 and NO2 at a power plant in northwestern Iran. Materials and Methods: SO2 and NO2 concentrations in the power plant exhaust gas and the power plant area were collected from official data recorded during regular monitoring. The health risk of exposure to the detected concentrations of SO2 and NO2 was assessed by calculating the hazard quotient based on the estimated chronic daily intake. Results: The analysis showed that the concentrations of SO2 and NO2 in the studied area were 12.60 and 20.18 μg/m3, respectively. However, the concentrations of the total studied pollutants in winter were 45.10% higher than those in summer. In addition, the mean hazard quotient of exposure to SO2 and NO2 was calculated as 0.0369 and 0.0905, respectively. But, the use of diesel for energy production in a power plant resulted in a 65.07% higher non-carcinogenic risk than the use of gas as a power plant fuel. Conclusion: Although the health risk of exposure to the studied pollutants was not significant (HI = 0.127) in the current situation, the use of diesel significantly increased the health risk owing to increased pollutant emissions. |
|
Article History: Received: 12 October 2025 Accepted: 20 November 2025 |
||
*Corresponding Author: Mohammad Aghanaghad Email: aqanaghad.eh@gmail.com Tel: +98 4436252744 |
||
Keywords: Air Pollution, Sulfur Dioxide, Nitrogen Dioxide, Non-Carcinogenic Risk. |
Citation: Sheikhmohammadi A, Mohammadi A, Atafar Z, et al. Health Risk Assessment of Exposure to SO2 and NO2 Resulting from Power Plant Fuel Change Using Monte Carlo Simulation. J Environ Health Sustain Dev. 2025; 10(4): 2870-7.
Introduction
Economic development has been dramatic in the last century, leading to social and environmental consequences 1. Urbanization and industrial development are consequences of economic development, which has led to an increase in the demand for energy for domestic and industrial use 2. Moreover, the expansion of health services and the rise in per capita income have significantly contributed to population growth, which in turn has been a crucial factor in the increased demand for energy in recent decades.3. This situation is significant in developing countries that compete for economic development 4. Therefore, one of the main needs in the world is to provide energy for domestic and industrial use 5. Although efforts to generate renewable and green energies have been considered in recent decades 6, fossil fuel power plants still have a significant share of electricity production in developing countries 7. Therefore, the increase in power plant units and electricity production has led to an increase in the production of polluting gases, including nitrogen dioxide (NO2) and sulfur dioxide (SO2), which can have negative environmental and health consequences 8.
Air pollution, which is directly caused by economic development and the expansion of pollutant emission sources such as cars, industries, and fossil fuel combustion, has increased in recent decades and is a major health problem, as it is a major contributor to premature mortality and morbidity 9, 10. There is now abundant evidence of the health consequences of air pollution and its effects on various body organs 11. Air pollution is a major cause or aggravating factor for many debilitating diseases, such as lung cancer, chronic obstructive pulmonary disease, asthma, diabetes, stroke, cardiovascular diseases, pneumonia, and dementia 12. The diversity of air pollutants and their multiple effects on organs have led to air pollution being estimated as the fourth global risk factor for premature mortality 9, 13. Awareness of the serious consequences of air pollution has led to the development of air pollution control methods in recent decades, the use of which in high-income countries has led to a reduction in air pollution 9. However, in developing countries, air pollution exposure remains a serious concern owing to economic and technological limitations 14. In developing countries, power plants are one of the most important centers of fossil fuel combustion, which have the potential to emit pollutants such as particulate matter (PM), SO2, and NO2 8.
SO2 and NO2, which are important gases emitted from power plants, have serious health consequences 15. SO2 can cause respiratory diseases and negatively affect lung function, which is more severe in people with more exposure 16. In addition to exposure time, the concentration of SO2 also affects the occurrence of its health consequences. Considering the effect of distance from the emission source on the concentration of the pollutant, people living further away will face a lower health risk 17. For example, with increasing distance to a radius of 300 m from the emission source, the risk of lung capacity and lung function have been reported by 1.37-fold and 1.62-fold, respectively 18. NO2 is also an important pollutant from power plant activity, and its effects have been reported in the occurrence of asthma, respiratory diseases, and cardiovascular diseases 19, 20. Exposure to NO2 reduces life expectancy and increases mortality due to cardiovascular and respiratory diseases 21.
Iran is a developing country that has increased the number and capacity of power plants in recent years owing to the increasing energy demand, which mostly uses fossil fuels. Although pollutants such as SO2 and NO2 are monitored regularly in Iranian power plants, these data are not routinely compared with national and international standards and are the basis for decision-making. Some previous studies have reported the risk from SO2 and NO2 emissions in fossil power plants in other parts of Iran8, 22; considering the climatic variation of Iran and the effect of climatic conditions on pollutant concentrations, as well as the lack of risk assessment for power plant workers, further studies could lead to increased scientific evidence for local policymakers to adopt risk control approaches. Therefore, assessing the health risks from exposure to these pollutants in proportion to the exposed population and pollutant concentration is a knowledge gap. This study aimed to assess the risk of SO2 and NO2 emissions from a fossil fuel power plant in northwestern Iran for plant workers and the population living near the plant.
Materials and Methods
Study area
This study was conducted in northwestern Iran, where pollutants emitted from a fossil fuel power plant were analyzed. In this combined cycle power plant, gas and diesel were used alternately in the experiments. Cities near the studied power plant included Khoy at 38.5455° N, 44.9590° E, and Urmia at 37.5498° N, 45.0786° E. The populations of Urmia was 1040000 people and the population of Khoy was 198000, making the total population living near the studied power plant 1220000 people. This region has a mountainous and cold climate with heavy snowfall. Winds blow 165 days a year at a speed of 7-16 m/s, and the average temperature is 9.8-10.8 ºC.
Data gathering
SO2 and NO2 concentrations in the power plant exhaust gas and the power plant area were collected from official data recorded during regular monitoring. Based on the recorded sampling characteristics, the sampling height was three meters, and the type of fuel used by the power plant was considered in the recorded data. The data were obtained by monitoring the pollutants from March 2024 to March 2025 (1403 Iranian calendar), which included monitoring conducted in all months. Pollutant detection was performed at 7-day intervals, so that four values were prepared for the studied pollutants each month.
Risk assessment
Estimating the health consequences of exposure to air pollutants using risk assessment is a common technique based on pollutant concentration and exposure duration 22. In this study, the health risks associated with exposure to the detected concentrations of SO2 and NO2 were assessed by calculating the hazard quotient (HQ). Equation 1 was used to estimate the chronic daily intake (CDI) 8, 23. After estimating the CDI for each pollutant, the health risk associated with exposure to each pollutant was estimated by calculating the HQ using Equation 2 18. Finally, the hazard index (HI), which includes the sum of the HQ values, was calculated using Equation 3. The definitions and values of the parameters used in the equations are listed in Table 1.
CDI = C × IR × EF × ED AT × BW (1)
HQ = CDI RfD (2)
HI =∑ HQ (3)
Economic development has been dramatic in the last century, leading to social and environmental consequences 1. Urbanization and industrial development are consequences of economic development, which has led to an increase in the demand for energy for domestic and industrial use 2. Moreover, the expansion of health services and the rise in per capita income have significantly contributed to population growth, which in turn has been a crucial factor in the increased demand for energy in recent decades.3. This situation is significant in developing countries that compete for economic development 4. Therefore, one of the main needs in the world is to provide energy for domestic and industrial use 5. Although efforts to generate renewable and green energies have been considered in recent decades 6, fossil fuel power plants still have a significant share of electricity production in developing countries 7. Therefore, the increase in power plant units and electricity production has led to an increase in the production of polluting gases, including nitrogen dioxide (NO2) and sulfur dioxide (SO2), which can have negative environmental and health consequences 8.
Air pollution, which is directly caused by economic development and the expansion of pollutant emission sources such as cars, industries, and fossil fuel combustion, has increased in recent decades and is a major health problem, as it is a major contributor to premature mortality and morbidity 9, 10. There is now abundant evidence of the health consequences of air pollution and its effects on various body organs 11. Air pollution is a major cause or aggravating factor for many debilitating diseases, such as lung cancer, chronic obstructive pulmonary disease, asthma, diabetes, stroke, cardiovascular diseases, pneumonia, and dementia 12. The diversity of air pollutants and their multiple effects on organs have led to air pollution being estimated as the fourth global risk factor for premature mortality 9, 13. Awareness of the serious consequences of air pollution has led to the development of air pollution control methods in recent decades, the use of which in high-income countries has led to a reduction in air pollution 9. However, in developing countries, air pollution exposure remains a serious concern owing to economic and technological limitations 14. In developing countries, power plants are one of the most important centers of fossil fuel combustion, which have the potential to emit pollutants such as particulate matter (PM), SO2, and NO2 8.
SO2 and NO2, which are important gases emitted from power plants, have serious health consequences 15. SO2 can cause respiratory diseases and negatively affect lung function, which is more severe in people with more exposure 16. In addition to exposure time, the concentration of SO2 also affects the occurrence of its health consequences. Considering the effect of distance from the emission source on the concentration of the pollutant, people living further away will face a lower health risk 17. For example, with increasing distance to a radius of 300 m from the emission source, the risk of lung capacity and lung function have been reported by 1.37-fold and 1.62-fold, respectively 18. NO2 is also an important pollutant from power plant activity, and its effects have been reported in the occurrence of asthma, respiratory diseases, and cardiovascular diseases 19, 20. Exposure to NO2 reduces life expectancy and increases mortality due to cardiovascular and respiratory diseases 21.
Iran is a developing country that has increased the number and capacity of power plants in recent years owing to the increasing energy demand, which mostly uses fossil fuels. Although pollutants such as SO2 and NO2 are monitored regularly in Iranian power plants, these data are not routinely compared with national and international standards and are the basis for decision-making. Some previous studies have reported the risk from SO2 and NO2 emissions in fossil power plants in other parts of Iran8, 22; considering the climatic variation of Iran and the effect of climatic conditions on pollutant concentrations, as well as the lack of risk assessment for power plant workers, further studies could lead to increased scientific evidence for local policymakers to adopt risk control approaches. Therefore, assessing the health risks from exposure to these pollutants in proportion to the exposed population and pollutant concentration is a knowledge gap. This study aimed to assess the risk of SO2 and NO2 emissions from a fossil fuel power plant in northwestern Iran for plant workers and the population living near the plant.
Materials and Methods
Study area
This study was conducted in northwestern Iran, where pollutants emitted from a fossil fuel power plant were analyzed. In this combined cycle power plant, gas and diesel were used alternately in the experiments. Cities near the studied power plant included Khoy at 38.5455° N, 44.9590° E, and Urmia at 37.5498° N, 45.0786° E. The populations of Urmia was 1040000 people and the population of Khoy was 198000, making the total population living near the studied power plant 1220000 people. This region has a mountainous and cold climate with heavy snowfall. Winds blow 165 days a year at a speed of 7-16 m/s, and the average temperature is 9.8-10.8 ºC.
Data gathering
SO2 and NO2 concentrations in the power plant exhaust gas and the power plant area were collected from official data recorded during regular monitoring. Based on the recorded sampling characteristics, the sampling height was three meters, and the type of fuel used by the power plant was considered in the recorded data. The data were obtained by monitoring the pollutants from March 2024 to March 2025 (1403 Iranian calendar), which included monitoring conducted in all months. Pollutant detection was performed at 7-day intervals, so that four values were prepared for the studied pollutants each month.
Risk assessment
Estimating the health consequences of exposure to air pollutants using risk assessment is a common technique based on pollutant concentration and exposure duration 22. In this study, the health risks associated with exposure to the detected concentrations of SO2 and NO2 were assessed by calculating the hazard quotient (HQ). Equation 1 was used to estimate the chronic daily intake (CDI) 8, 23. After estimating the CDI for each pollutant, the health risk associated with exposure to each pollutant was estimated by calculating the HQ using Equation 2 18. Finally, the hazard index (HI), which includes the sum of the HQ values, was calculated using Equation 3. The definitions and values of the parameters used in the equations are listed in Table 1.
Table 1: Details of risk assessment parameters 8, 22
| Parameter | Definition | Value/Unit |
| CDI | Chronic daily intake | μg |
| C | NO2 or SO2 concentration | μg/m3 |
| IR | Inhalation rate | 20 m3/day |
| EF | Exposure frequency | 365 day |
| ED | Exposure duration | year (30) |
| AT | Time average period | EF×ED |
| BW | Body weight | 70 kg |
| HQ | Hazard quotient | - |
| RfD | Reference dose | μg /kg/day |
| HI | Hazard index | - |
Results
The detected concentrations of the studied pollutants, including SO2 and NO2, are listed in Table 2. The results showed that the average concentration of detected NO2 at the power plant chimney outlet was 7.101 mg/m3, whereas the average concentration of detected SO2 was 10.441 mg/m3. In addition, the detected concentrations of NO2 and SO2 in the power plant area were 19.65 µg/m3 and 13.23 µg/m3, respectively. A comparison of the concentrations of the studied pollutants resulting from the use of different fossil fuels in the power plant is shown in Figure 1. The results showed that the concentration of NO2 resulting from diesel combustion was 43.11% higher than that resulting from gas combustion. In addition, the concentration of emitted SO2 resulting from gas combustion was 55.41% lower than that resulting from diesel combustion.
The detected concentrations of the studied pollutants, including SO2 and NO2, are listed in Table 2. The results showed that the average concentration of detected NO2 at the power plant chimney outlet was 7.101 mg/m3, whereas the average concentration of detected SO2 was 10.441 mg/m3. In addition, the detected concentrations of NO2 and SO2 in the power plant area were 19.65 µg/m3 and 13.23 µg/m3, respectively. A comparison of the concentrations of the studied pollutants resulting from the use of different fossil fuels in the power plant is shown in Figure 1. The results showed that the concentration of NO2 resulting from diesel combustion was 43.11% higher than that resulting from gas combustion. In addition, the concentration of emitted SO2 resulting from gas combustion was 55.41% lower than that resulting from diesel combustion.
Table 2: Average concentration of studied pollutants in the chimney (a) and the power plant premises (b) (µg/m3)
| NO2 | SO2 | |||
| a | b | a | b | |
| Spring | 5376.38 (SD = 511.2) |
16.98 (SD = 1.63) |
2347.91 (SD = 181.2) |
11.60 (SD = 1.33) |
| Summer | 7894.44 (SD = 631.5) |
22.12 (SD = 1.94) |
1483.61 (SD = 97.5) |
9.25 (SD = 1.1) |
| Autumn | 6002.50 (SD = 493.8) |
12.78 (SD = 1.03) |
3246.25 (SD = 219.3) |
13.31 (SD = 0.95) |
| Winter | 9131.81 (SD = 823.1) |
26.74 (SD = 2.11) |
34689.77 (SD = 224.9) |
18.78 (SD = 1.53) |
| Gas fuel | 6747.22 (SD = 536.9) |
16.19 (SD = 1.19) |
2162.22 (SD = 293.6) |
5.11 (SD = 0.61) |
| Disel fuel | 11270.15 (SD = 917.7) |
23.7 (SD = 1.82) |
72520.24 (SD = 463.7) |
11.46 (SD = 1.42) |
| Total | 7079.77 (SD = 606.3) |
20.18 (SD = 1.8) |
7335.58 (SD = 517.4) |
12.60 (SD = 1.51) |
Figure 1: Concentration of pollutants detected in the power plant area affected by different fuels (µg/m3); the horizontal graph shows the total concentration, and the vertical graph shows the individual pollutant concentrations.
As shown in Figure 1, fuel changes affect the concentration of pollutants emitted from power plants; however, climate and weather conditions can also affect the intensity of exposure to pollutants. The results showed that the average concentration of NO2 detected in the chimney in summer was 13.55% lower than that in winter, whereas the concentration of NO2 detected in the power plant area was 17.27% lower in summer than in winter. In addition, the concentration of SO2 detected in the chimney and power plant area was 23.4 times and 50.74% lower in summer than in winter, respectively. The results of the non-carcinogenic risk assessment of exposure to the mean concentrations of SO2 and NO2 are shown in Table 3. This assessment was based on monthly average data detected in the power plant's internal premises and aimed to assess the risk for power-plant workers. Therefore, the concentration of pollutants resulting from the current situation of alternating diesel and gas use was used for risk assessment. The results showed that the HQ values due to exposure to SO2 and NO2 were 3.69E-02 and 9.05E-02, respectively. The results of the HQ assessment for NO2 and SO2, the pollutants considered in this study, are shown in Figures 2 and 3. The results showed that the HI resulting from exposure to the studied pollutants was 2.32E-01.
Table 3: Assessed risk based on average data
| NO2 | SO2 | |
| CDI | 1.81 | 1.11 |
| HQ | 9.05E-02 | 3.69E-02 |
| HI | 1.27E-01 | |
Figure 2: Calculated HQ associated with NO2 exposure by Monte Carlo simulation.
Figure 3: Calculated HQ associated with SO2 exposure using Monte Carlo simulation.
Discussion
Although SO2 and NO2 emissions from electricity generation in power plants have been reported in many previous studies 15, the concentration of emitted pollutants is affected by various factors, including the fuel type 8. Nurhisanah and Hasyim. (2021) reported the SO2 concentration from power plant activity in Indonesia as 0.085 mg/m3 18. Wang et al. 2012 studied the pollutants emitted from power plant in China and reported the NO2 concentration by 9.58 Tg in 2007 24. Therefore, different concentrations of pollutants, including SO2 and NO2, have been emitted from power plants. The power generation technology in the power plant and pollutant control equipment have a significant impact on the concentration of the emitted pollutant 25, which could be one of the important reasons for the different reported concentrations. In addition, as the results of this study showed, the type of fuel can cause changes in the concentration of pollutants emitted from power plants. For example, Alavi et al. (2017) reported a difference in the SO2 concentration emitted from a power plant owing to the use of different fuels, including gas and diesel, by 15.
Differences in the concentrations of pollutants emitted from power plants have also been reported in other studies. Two studies in Taiwan and China showed that the concentrations of pollutants resulting from power plant activities, including SO2 and NO2, were higher in the cold than in the warm season. Zhang et al. (2021) reported the SO2 concentration resulting from the operation of a power plant in China as 25.74 μg/m3 and 15.63 μg/m3 in winter and summer, respectively, indicating a 39.2% difference in seasonal variation 26. In addition, increasing the distance from the power plant will cause a decrease in the pollutant concentration, such that the concentration of NO2 detected at a distance of more than 4.7 km from the studied power plant in Taiwan decreased by 21% 17.
The health consequences of exposure to air pollutants are a serious concern, the severity of which depends on pollutant concentration, exposure duration, and physical characteristics 22. In recent years, the development of techniques for assessing the carcinogenic and non-carcinogenic risks associated with air pollutants has provided a method for ranking the severity of the consequences of air pollution 27. The difference in the calculated risk for the studied pollutants is due to the difference in pollutant concentrations and the difference in the reference dose associated with each pollutant 8. However, differences in exposure time and individual characteristics can also affect the level of risk associated with a pollutant. According to Fouladi-Fard et al. (2025), the concentration of NO2 emitted from a power plant in Iran was reported as 4.19, and the associated Hazard Quotient (HQ) was calculated to be 0.03.Also, in a study in China, the HQ resulting from exposure to 0.085 mg/m3 of SO2 emitted from a power plant was reported to be 0.0959 18.
Considering the range of variables affecting the non-carcinogenic risk of exposure to air pollutants, risk assessment using Monte Carlo simulation can provide more accurate results than risk assessment based on the average of the data 28. Considering that an HI higher than 1 indicates a significant health risk 8, it can be concluded that the studied pollutants did not pose a significant health risk considering individual characteristics and the exposure time in the current situation. These results are comparable to the risks assessed in previous studies. Fouladi-Fard et al. (2025), reported the HI resulting from exposure to SO2 and NOx emitted from a power plant in Iran was reported by 0.69 8. The difference in fuel type has an important effect on the concentration of emitted pollutants, including SO2 and NO2, which could be an important factor in the difference in the calculated HI in different studies 18, 22, 28.
The results showed that the use of diesel in the power plant led to an increase in the concentrations of SO2 and NO2 by 55.41% and 43.11%, respectively. Therefore, reducing the proportion of diesel used in power plants is suggested to reduce the health risks of exposure to emitted pollutants from power plants. Although the health risk calculated in this study was not significant (HI less than 1), reducing the exposure time by reducing working hours can reduce the health risk. This study had both strengths and limitations. The use of Monte Carlo simulation to assess health risks, which led to more accurate results, was a strength of this study. However, assessing the risk for the population beyond the power plant site was a limitation of this study, which could be considered in future studies.
Conclusion
The concentrations of SO2 and NO2 resulting from the operation of a power plant in northwestern Iran were studied, and the associated health risks were assessed. The results showed that the average concentrations of SO2 and NO2 were 12.60 and 20.18 μg/m3, respectively. The type of power plant fuel was effective in the concentration of emitted pollutants, such that the total of emitted SO2 and NO2 when using diesel and gas as power plant fuel was 35.16 and 21.30 μg/m3, respectively. The HQ resulting from exposure to SO2 and NO2 was estimated to be 6.08E-02 and 1.71E-01, respectively, for the children. Considering the HI less than 1 (2.32E-01), the health risk resulting from exposure to the detected concentrations was not significant. However, the effect of using diesel as a power plant fuel regarding the sharp increase in pollutant concentrations (65.07%) was important. Therefore, reducing the use of diesel in power plants should be considered in future studies. In addition, the increase in pollutant concentrations in the cold season could be due to the increased use of diesel and atmospheric conditions such as inversion. Therefore, when using diesel as a power plant fuel in the cold season, the regular use of personal protective equipment is necessary.
Acknowledgements
The authors would like to thank the authorities at Khoy University of Medical Sciences for their financial support.
Conflicts of interest
The authors declared no conflicts of interest.
Funding
This research was financially supported by Khoy University of Medical Sciences (No. 403000022).
Ethical Considerations
The Ethics Committee of Khoy University of Medical Sciences approved this study protocol.
Code of Ethics
The ethic code of current study is IR.Khoy.REC.1403.039
Author contributions
Amir Sheikhmohammadi: Methodology, Formal analysis, Writing – original draft, Writing – review & editing. Amir Mohammadi, Zahra Atafar, Ahmad Shakuri, Shiva Rasoulzadeh: Investigation, Methodology, Writing–review& editing. Mohammad Aghanaghad: Investigation, Formal analysis, Methodology, Writing–review & editing, Supervision.
This is an Open-Access article distributed in accordance with the terms of the Creative Commons Attribution (CC BY 4.0) license, which permits others to distribute, remix, adapt, and build upon this work for commercial use.
References
1. Badeenezhad A, Darabi K, Torkashvand J, et al. Economic and waste flow analysis of available scenarios to improve food waste management in Tehran. Results Eng. 2024;24:102852.
2. Abbasi KR, Shahbaz M, Jiao Z, et al. How energy consumption, industrial growth, urbanization, and CO2 emissions affect economic growth in Pakistan? a novel dynamic ARDL simulations approach. Energy. 2021;221:119793.
3. Khan I, Hou F, Irfan M, et al. Does energy trilemma a driver of economic growth? the roles of energy use, population growth, and financial development. Renew Sustain Energy Rev. 2021;146:111157.
4. Shahbaz M, Topcu BA, Sarıgül SS, et al. The effect of financial development on renewable energy demand: the case of developing countries. Renew Energy. 2021;178:1370-80.
5. Barykina Y, Chernykh A, Na B, editors. Energy production as a basis for sustainable development in the BRICS countries. InIOP Conference Series: Earth and Environmental Science; 2022: IOP Publishing; 2022; 990(1):012016.
6. Androniceanu A, Sabie OM. Overview of green energy as a real strategic option for sustainable development. Energies (Basel). 2022;15(22):8573.
7. Holechek JL, Geli HM, Sawalhah MN, et al. A global assessment: can renewable energy replace fossil fuels by 2050?. Sustainability. 2022;14(8):4792.
8. Fouladi-Fard R, Naddafi K, Hosseini MR, et al. Health risk assessment and Sobol’sensitivity analysis of power plant air pollution (SO2 and NOX): the effect of power plant fuel change. Integr Environ Assess Manag. 2025;21(1):161-71.
9. Boogaard H, Crouse DL, Tanner E, et al. Assessing adverse health effects of long-term exposure to low levels of ambient air pollution: the HEI experience and what’s next?. Environ Sci Technol. 2024;58(29):12767-83.
10. Dehghani MH, Hopke PK, Asghari FB, et al. The effect of the decreasing level of Urmia Lake on particulate matter trends and attributed health effects in Tabriz, Iran. Microchemical Journal. 2020;153:104434.
11. Torkashvand J, Jonidi Jafari A, Pasalari H, et al. The potential osteoporosis due to exposure to particulate matter in ambient air: mechanisms and preventive methods. Journal of the Air & Waste Management Association. 2022;72(9):925-34.
12. Schraufnagel DE, Balmes JR, Cowl CT, et al. Air pollution and noncommunicable diseases: a review by the forum of international respiratory societies’ environmental committee, part 2: air pollution and organ systems. CHEST. 2019;155(2):417-26.
13. L Murray C, Y Aravkin A, Zheng P, et al. Global burden of 87 risk factors in 204 countries and territories, 1990–2019: a systematic analysis for the Global Burden of Disease Study 2019. The Lancet. 2020;396(10258):1223-49.
14. Torkashvand J, Jafari AJ, Hopke PK, et al. Airborne particulate matter in Tehran’s ambient air. J Environ Health Sci Eng. 2021;19:1179-91.
15. Valverde V, Pay MT, Baldasano JM. A model-based analysis of SO2 and NO2 dynamics from coal-fired power plants under representative synoptic circulation types over the Iberian Peninsula. Sci Total Environ. 2016;541:701-13.
16. Orellano P, Reynoso J, Quaranta N. Short-term exposure to sulphur dioxide (SO2) and all-cause and respiratory mortality: a systematic review and meta-analysis. Environ Int. 2021;150:106434.
17. Huang Y-K, Luvsan M-E, Gombojav E, et al. Land use patterns and SO2 and NO2 pollution in Ulaanbaatar, Mongolia. Environmental Research. 2013;124:1-6.
18. Nurhisanah S, Hasyim H. Environmental health risk assessment of sulfur dioxide (SO2) at workers around in combined cycle power plant (CCPP). Heliyon. 2022;8(5).
19. Hvidtfeldt UA, Sørensen M, Geels C, et al. Long-term residential exposure to PM2.5, PM10, black carbon, NO2, and ozone and mortality in a Danish cohort. Environ Int. 2019;123:265-72.
20. He MZ, Kinney PL, Li T, et al. Short-and intermediate-term exposure to NO2 and mortality: a multi-county analysis in China. Environmental Pollution. 2020;261:114165.
21. Zhao S, Liu S, Sun Y, et al. Assessing NO2-related health effects by non-linear and linear methods on a national level. Sci Total Environ. 2020;744:140909.
22. Hesami Arani M, Jaafarzadeh N, Moslemzadeh M, et al. Dispersion of NO2 and SO2 pollutants in the rolling industry with AERMOD model: a case study to assess human health risk. J Environ Health Sci Eng. 2021;19(2):1287-98.
23. Abbasnia A, Ghoochani M, Yousefi N, et al. Prediction of human exposure and health risk assessment to trihalomethanes in indoor swimming pools and risk reduction strategy. Human and Ecological Risk Assessment: An International Journal. 2019;25(8):2098-115.
24. Wang S, Zhang Q, Streets D, et al. Growth in NO x emissions from power plants in China: bottom-up estimates and satellite observations. Atmos Chem Phys. 2012;12(10):4429-47.
25. Nihalani S, Mishra Y, Juremalani J, editors. Emission control technologies for thermal power plants. InIOP conference series: Materials science and engineering; 2018: IOP Publishing. 2018;330(1):012122.
26. Zhang X, Wang Z, Cheng M, et al. Long-term ambient SO2 concentration and its exposure risk across China inferred from OMI observations from 2005 to 2018. Atmos Res. 2021;247: 105150.
27. Hassan Bhat T, Jiawen G, Farzaneh H. Air pollution health risk assessment (AP-HRA), principles and applications. Int J Environ Res Public Health. 2021;18(4):1935.
28. Kamani H, Baniasadi M, Abdipour H, et al. Health risk assessment of BTEX compounds (benzene, toluene, ethylbenzene and xylene) in different indoor air using Monte Carlo simulation in zahedan city, Iran. Heliyon. 2023;9(9).
Type of Study: Original articles |
Subject:
Air and waste management
Received: 2025/10/12 | Accepted: 2025/11/20 | Published: 2025/12/25
Received: 2025/10/12 | Accepted: 2025/11/20 | Published: 2025/12/25
Send email to the article author
| Rights and permissions | |
 |
This work is licensed under a Creative Commons Attribution-NonCommercial 4.0 International License. |
