
Volume 11, Issue 2 (June 2026)
J Environ Health Sustain Dev 2026, 11(2): 3051-3062 |
Back to browse issues page


Ethics code: IR.SSU.REC.1403.134


Download citation:
BibTeX | RIS | EndNote | Medlars | ProCite | Reference Manager | RefWorks
Send citation to:


BibTeX | RIS | EndNote | Medlars | ProCite | Reference Manager | RefWorks
Send citation to:
Hosseini S, Taheri Soodejani M, Shakeri Shamsi F, Hazar N. Trend and Geographical Distribution of Diabetes Mellitus Mortality Attributed to Air Pollution in Iran from 1990 To 2021. J Environ Health Sustain Dev 2026; 11 (2) :3051-3062
URL: http://jehsd.ssu.ac.ir/article-1-963-en.html
URL: http://jehsd.ssu.ac.ir/article-1-963-en.html


Diabetes Research Center, Non-Communicable Diseases Research Institute, Shahid Sadoughi University of Medical Sciences, Yazd, Iran
Keywords: Diabetes Mellitus, Environmental Pollution, Mortality, Chronic Disease, Public Health, Iran.
Full-Text [PDF 622 kb]
(180 Downloads)
| Abstract (HTML) (386 Views)
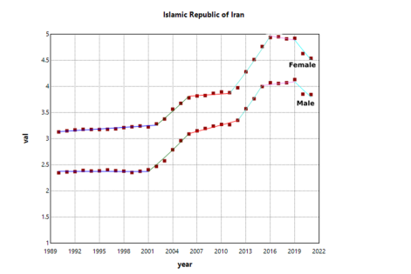
Figure 1: The annual percent change over 1990–2021 in mortality rate per 100,000 population in T2DM attributable to air pollution in Iran.
Table 1: The trends in the annual percent change in mortality rate per 100,000 population in T2DM attributable to air pollution in Iranian females over 1990–2021.
Table 2: The trends in the annual percent change in mortality rate per 100,000 population in T2DM attributable to air pollution in Iranian males over 1990–2021.
Table 3: The average annual percent change in mortality rate per 100,000 population in T2DM attributable to air pollution in Iran and its provinces over 1990–2021.
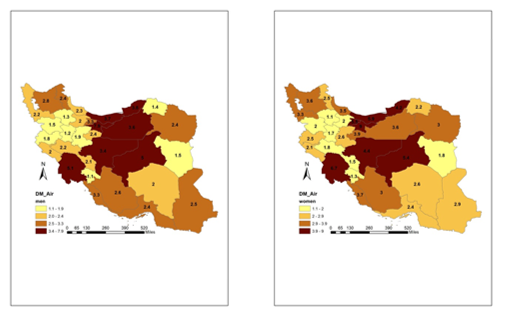
Figure 2: Geographic distribution of air pollution-related diabetes mortality rates by gender in Iran, 2021 (per 100,000 population).
Full-Text: (90 Views)
Trend and Geographical Distribution of Diabetes Mellitus Mortality Attributed to Air Pollution in Iran from 1990 To 2021
Saeed Hosseini 1, Moslem Taheri Soodejani 2,1, Fateme Shakeri Shamsi 3, Narjes Hazar 3*
1 Center for Healthcare Data Modeling, Department of Biostatistics and Epidemiology, School of Public Health, Shahid Sadoughi University of Medical Sciences, Yazd, Iran.
2 Clinical Research Development Center, Shahid Sadoughi Hospital, Shahid Sadoughi University of Medical Sciences, Yazd, Iran.
3 Diabetes Research Center, Non-Communicable Diseases Research Institute, Shahid Sadoughi University of Medical Sciences, Yazd, Iran.
Saeed Hosseini 1, Moslem Taheri Soodejani 2,1, Fateme Shakeri Shamsi 3, Narjes Hazar 3*
1 Center for Healthcare Data Modeling, Department of Biostatistics and Epidemiology, School of Public Health, Shahid Sadoughi University of Medical Sciences, Yazd, Iran.
2 Clinical Research Development Center, Shahid Sadoughi Hospital, Shahid Sadoughi University of Medical Sciences, Yazd, Iran.
3 Diabetes Research Center, Non-Communicable Diseases Research Institute, Shahid Sadoughi University of Medical Sciences, Yazd, Iran.
| A R T I C L E I N F O | ABSTRACT | |
| ORIGINAL ARTICLE | Introduction: The escalating incidence and mortality rates of diabetes, coupled with the growing threat of air pollution, pose a substantial threat to public health in Iran. This study seeks to examine the geographical distribution and temporal trends of diabetes-related deaths specifically linked to air pollution across the country. Methods: Utilizing data from the Global Burden of Disease (GBD) study, we employed Joinpoint regression analysis to identify significant shifts in the mortality trends of type 2 diabetes mellitus (T2DM) linked to air pollution. Furthermore, spatial distribution patterns for the year 2021 were mapped and analyzed using ArcMap GIS v.10. Results: The mortality rate of T2DM attributable to air pollution in Iran exhibited an upward trend between 1990 and 2019, after which a subsequent decline was observed from 2019 to 2021. The highest annual percentage change in females occurred between 2011 and 2016 (5.134, 95% UI: 4.704–5.563), whereas in males, it occurred between 2012 and 2015 (6.275, 95% UI: 4.867–6.934). The highest average annual percentage change in females was observed in Gilan (4.427, 95% UI: 4.305–4.535), and in males, it was observed in Bushehr (4.125, 95% UI: 3.873–4.320). Geographical analysis revealed that in 2021, Tehran and Khuzestan had the highest mortality rates, whereas the lowest rates were recorded in Zanjan, Kohgiluyeh, and Boyer-Ahmad for females and Kohgiluyeh, Boyer-Ahmad, and Hamadan for males. Conclusion: These findings highlight the continued need for stronger environmental control measures, especially in high-risk areas, to further reduce the burden of air pollution-related diabetes mortality in Iran. |
|
Article History: Received: 13 February 2026 Accepted: 20 April 2026 |
||
*Corresponding Author: Narjes Hazar Email: Narjeshazar@yahoo.com Tel: +98 9132592217 |
||
Keywords: Diabetes Mellitus, Environmental Pollution, Mortality, Chronic Disease, Public Health, Iran. |
Citation: Hosseini S, Taheri Soodejani M, Shakeri Shamsi F, et al. Trend and Geographical Distribution of Diabetes Mellitus Mortality Attributed to Air Pollution in Iran from 1990 To 2021. J Environ Health Sustain Dev. 2026; 11(2): 3051-62.
Introduction
The global prevalence of type 2 diabetes is increasing, with projections indicating a significant increase in the number of affected individuals worldwide. Research suggests that in 2021, over 537 million cases of diabetes were reported globally, with estimates indicating that this figure could reach 783 million by 2045 1, 2.
The burden of type 2 diabetes is rising, and the age-standardized incidence rate of this disease has steadily increased from 1990 to 2019, particularly in regions with high socioeconomic development indices (SDI), such as Central Asia, South Asia, as well as Sub-Saharan Africa 3. Furthermore, the prevalence of type 2 diabetes is projected to continue increasing, reaching 7,079 per 100,000 by 2030, indicating a concerning trend in low-income countries 4. Globally, there has been a significant rise in the age-standardized incidence rates and disability-adjusted life years (DALYs) associated with type 2 diabetes. This upward trend is particularly pronounced in Southeast Asia and within the middle SDI window, characterized by low-to-middle income levels 5.
Type 2 diabetes is recognized as a global health crisis, and multiple factors contribute to its incidence and mortality. In recent years, researchers have increasingly focused on the link between environmental factors and this chronic disease 6, 7. Air pollution is one such environmental factor that has been extensively studied. Emerging evidence has underscored a profound association between air pollution exposure and an elevated risk of both type 2 diabetes onset and related mortality 1, 8, 9.
Systematic evidence indicates that increased exposure to ambient air pollutants is closely linked to diabetes risk; specifically, every 10-μg/m3 increment in PM2.5 and NO2 is associated with an 8–10% rise in T2DM risk 10. Another meta-analysis reported similar findings, with PM2.5, PM10, NO2, and O3 significantly linked to increased diabetes-related mortality 11. A large-scale cohort study conducted in the United States demonstrated that long-term exposure to PM2.5 and NO2 was associated with increased diabetes-related mortality 12.
In recent years, diabetes has experienced a concerning upward trend as one of the prevalent non-communicable diseases in Iran. According to the latest official statistics, 13.2% of the country's population is affected by this disease 13-17. However, air pollution has become a serious environmental and public health concern in Iran, particularly in urban areas. Current trends show that many cities consistently exceed permissible levels of key air pollutants, including particulate matter (PM), sulfur dioxide (SO₂), and ozone 18. Despite the growing burden of both diabetes and air pollution in Iran, no comprehensive national study has simultaneously examined long-term trends and provincial disparities in air pollution–attributable diabetes mortality. Therefore, this study aimed to address this gap by providing a temporal and geographical analysis at the national level.
Methods
Study Area
Iran is one of the Eastern Mediterranean regions in western Asia, and has 31 provinces. According to the last estimation, the population is approximately 84000000, of which is an almost equal percentage of men and women (50.5% men and 49.5% women) 19.
Data Source and Processing
This study utilized the latest Global Burden of Disease (GBD) dataset, characterized by its standardized methodology and broad-scale collaboration involving more than 10,000 experts from over 150 countries. The GBD metrics are derived from a robust array of sources, ranging from vital registration and censuses to clinical informatics and disease registries. Subnational estimates for Iran were specifically incorporated at the first administrative level 20. The dataset provides annual updates, allowing for a longitudinal analysis spanning from 1990 to 2021. This dataset offers estimates for various measures, including mortality trends over time and across countries from 1990 to 2021. More details on GBD 2021 are provided elsewhere 20. We used the GBD dataset to estimate the trend analysis of the T2D death rate attributable to air pollution according to sex and Iran provinces 21.
Statistical Analysis
In present study, Joinpoint regression was used to detect changes in the trend analysis of the T2D age-standardised death rate attributable to air pollution. Joinpoint regression was selected because it allows the identification of significant changes in trend over time and detects years (joinpoints) in which the slope of the trend significantly changes. This method is particularly suitable for long-term time-series analyses where non-linear patterns may occur. In this method, the annual death rate attributable to air pollution for T2D and its standard error (SE) are used as inputs to the model. To characterize temporal trends, Annual Percent Changes (APC) and Average Annual Percent Changes (AAPC) were estimated, along with their corresponding 95% Uncertainty Intervals (UIs), for each sex and province. In this model, ify x y x = b 0 + b 1 x b 0 b 1
APC = ( e b 1 - 1)×100
Additionally, the AAPC was determined as the weighted mean of the APCs, as follows:
AAPC =( e Σ w i AP c i ∑ w i - 1)×100
The years in which trend changes occurred were considered joinpoints, and the trend changes between these points were examined. The significance of the identified trends was assessed using the Monte Carlo permutation method. All statistical analyses were performed using Joinpoint software, developed by the US National Cancer Institute. Because the study was based on GBD 2021 estimates, rates were already age-standardized and derived from comparative risk assessment models that adjust for key demographic factors. Therefore, additional adjustment for confounders at the analytical stage was not performed.
Exposure Definition
In the GBD 2021 framework, air pollution–attributable mortality includes exposure to ambient particulate matter pollution (PM2.5) and indoor air pollution stemming from the combustion of solid fuels, as defined by the comparative risk assessment methodology. These exposures were not directly measured in this study but were obtained from GBD-modeled estimates.
Geographic Analysis
The geographic distribution of air pollution-related diabetes mortality in 2021, based on 100000 people and with a 95% UI, was visualized at the provincial level. Spatial analysis was performed using ArcMap GIS v.10 software to highlight the regional patterns.
Methodological Considerations
GBD estimates are derived from multiple data sources using statistical modeling techniques to address data gaps and inconsistencies in the data. While this approach enhances comparability across regions and years, the estimates remain subject to uncertainty related to data availability, model assumptions and potential misclassification.
Result
Trend Analysis Results
From 1990 to 2021, the death rate per 100,000 due to air pollution in Iranian T2DM patients exhibited a biphasic pattern marked by an initial rise until 2019 and a subsequent decline through 2021 for both sexes (Figure 1). The trend analysis of the death rate in T2DM females attributable to air pollution showed the highest APC between 2011 and 2016 (5.134, 95%UI; 4.704, 5.563) and the lowest between 1990 and 2002 (0.322, 95%UI; 0.173, 0.452) (Table 1). In males, the APC was highest between 2012 and 2015 (6.275, 95%UI; 4.867, 6.934) and lowest between 2006 and 2012 (1.293, 95% UI; 0.716, 1.753) (Table 2).
The global prevalence of type 2 diabetes is increasing, with projections indicating a significant increase in the number of affected individuals worldwide. Research suggests that in 2021, over 537 million cases of diabetes were reported globally, with estimates indicating that this figure could reach 783 million by 2045 1, 2.
The burden of type 2 diabetes is rising, and the age-standardized incidence rate of this disease has steadily increased from 1990 to 2019, particularly in regions with high socioeconomic development indices (SDI), such as Central Asia, South Asia, as well as Sub-Saharan Africa 3. Furthermore, the prevalence of type 2 diabetes is projected to continue increasing, reaching 7,079 per 100,000 by 2030, indicating a concerning trend in low-income countries 4. Globally, there has been a significant rise in the age-standardized incidence rates and disability-adjusted life years (DALYs) associated with type 2 diabetes. This upward trend is particularly pronounced in Southeast Asia and within the middle SDI window, characterized by low-to-middle income levels 5.
Type 2 diabetes is recognized as a global health crisis, and multiple factors contribute to its incidence and mortality. In recent years, researchers have increasingly focused on the link between environmental factors and this chronic disease 6, 7. Air pollution is one such environmental factor that has been extensively studied. Emerging evidence has underscored a profound association between air pollution exposure and an elevated risk of both type 2 diabetes onset and related mortality 1, 8, 9.
Systematic evidence indicates that increased exposure to ambient air pollutants is closely linked to diabetes risk; specifically, every 10-μg/m3 increment in PM2.5 and NO2 is associated with an 8–10% rise in T2DM risk 10. Another meta-analysis reported similar findings, with PM2.5, PM10, NO2, and O3 significantly linked to increased diabetes-related mortality 11. A large-scale cohort study conducted in the United States demonstrated that long-term exposure to PM2.5 and NO2 was associated with increased diabetes-related mortality 12.
In recent years, diabetes has experienced a concerning upward trend as one of the prevalent non-communicable diseases in Iran. According to the latest official statistics, 13.2% of the country's population is affected by this disease 13-17. However, air pollution has become a serious environmental and public health concern in Iran, particularly in urban areas. Current trends show that many cities consistently exceed permissible levels of key air pollutants, including particulate matter (PM), sulfur dioxide (SO₂), and ozone 18. Despite the growing burden of both diabetes and air pollution in Iran, no comprehensive national study has simultaneously examined long-term trends and provincial disparities in air pollution–attributable diabetes mortality. Therefore, this study aimed to address this gap by providing a temporal and geographical analysis at the national level.
Methods
Study Area
Iran is one of the Eastern Mediterranean regions in western Asia, and has 31 provinces. According to the last estimation, the population is approximately 84000000, of which is an almost equal percentage of men and women (50.5% men and 49.5% women) 19.
Data Source and Processing
This study utilized the latest Global Burden of Disease (GBD) dataset, characterized by its standardized methodology and broad-scale collaboration involving more than 10,000 experts from over 150 countries. The GBD metrics are derived from a robust array of sources, ranging from vital registration and censuses to clinical informatics and disease registries. Subnational estimates for Iran were specifically incorporated at the first administrative level 20. The dataset provides annual updates, allowing for a longitudinal analysis spanning from 1990 to 2021. This dataset offers estimates for various measures, including mortality trends over time and across countries from 1990 to 2021. More details on GBD 2021 are provided elsewhere 20. We used the GBD dataset to estimate the trend analysis of the T2D death rate attributable to air pollution according to sex and Iran provinces 21.
Statistical Analysis
In present study, Joinpoint regression was used to detect changes in the trend analysis of the T2D age-standardised death rate attributable to air pollution. Joinpoint regression was selected because it allows the identification of significant changes in trend over time and detects years (joinpoints) in which the slope of the trend significantly changes. This method is particularly suitable for long-term time-series analyses where non-linear patterns may occur. In this method, the annual death rate attributable to air pollution for T2D and its standard error (SE) are used as inputs to the model. To characterize temporal trends, Annual Percent Changes (APC) and Average Annual Percent Changes (AAPC) were estimated, along with their corresponding 95% Uncertainty Intervals (UIs), for each sex and province. In this model, if
Additionally, the AAPC was determined as the weighted mean of the APCs, as follows:
The years in which trend changes occurred were considered joinpoints, and the trend changes between these points were examined. The significance of the identified trends was assessed using the Monte Carlo permutation method. All statistical analyses were performed using Joinpoint software, developed by the US National Cancer Institute. Because the study was based on GBD 2021 estimates, rates were already age-standardized and derived from comparative risk assessment models that adjust for key demographic factors. Therefore, additional adjustment for confounders at the analytical stage was not performed.
Exposure Definition
In the GBD 2021 framework, air pollution–attributable mortality includes exposure to ambient particulate matter pollution (PM2.5) and indoor air pollution stemming from the combustion of solid fuels, as defined by the comparative risk assessment methodology. These exposures were not directly measured in this study but were obtained from GBD-modeled estimates.
Geographic Analysis
The geographic distribution of air pollution-related diabetes mortality in 2021, based on 100000 people and with a 95% UI, was visualized at the provincial level. Spatial analysis was performed using ArcMap GIS v.10 software to highlight the regional patterns.
Methodological Considerations
GBD estimates are derived from multiple data sources using statistical modeling techniques to address data gaps and inconsistencies in the data. While this approach enhances comparability across regions and years, the estimates remain subject to uncertainty related to data availability, model assumptions and potential misclassification.
Result
Trend Analysis Results
From 1990 to 2021, the death rate per 100,000 due to air pollution in Iranian T2DM patients exhibited a biphasic pattern marked by an initial rise until 2019 and a subsequent decline through 2021 for both sexes (Figure 1). The trend analysis of the death rate in T2DM females attributable to air pollution showed the highest APC between 2011 and 2016 (5.134, 95%UI; 4.704, 5.563) and the lowest between 1990 and 2002 (0.322, 95%UI; 0.173, 0.452) (Table 1). In males, the APC was highest between 2012 and 2015 (6.275, 95%UI; 4.867, 6.934) and lowest between 2006 and 2012 (1.293, 95% UI; 0.716, 1.753) (Table 2).
Figure 1: The annual percent change over 1990–2021 in mortality rate per 100,000 population in T2DM attributable to air pollution in Iran.
Table 1: The trends in the annual percent change in mortality rate per 100,000 population in T2DM attributable to air pollution in Iranian females over 1990–2021.
| Segment (Year range) |
Annual Percentage Change (95% UI) | P-Value |
| 1990-2002 | 0.322 (0.173, 0.452) | 0.004* |
| 2002-2006 | 4.013 (3.203, 4.982) | 0.003* |
| 2006-2011 | 0.273 (-0.186, 0.793) | 0.162 |
| 2011-2016 | 5.134 (4.704, 5.563) | 0.004* |
| 2016-2019 | -0.536 (-1.151, 1.719) | 0.150 |
| 2019-2021 | -3.962 (-5.195, -2.735) | 0.000* |
Table 2: The trends in the annual percent change in mortality rate per 100,000 population in T2DM attributable to air pollution in Iranian males over 1990–2021.
| Segment (Year range) |
Annual Percentage Change (95% UI) | P-Value |
| 1990-2001 | -0.017 (-0.204, 0.164) | 0.824 |
| 2001-2006 | 5.492 (4.893, 5.993) | 0.002* |
| 2006-2012 | 1.293 (0.716, 1.753) | 0.003* |
| 2012-2015 | 6.275 (4.867, 6.934) | 0.000* |
| 2015-2019 | 0.431 (-0.105, 1.144) | 0.093 |
| 2019-2021 | -3.655 (-5.025, -2.034) | 0.000* |
Table 3 presents the AAPC trends from 1990 to 2021 regarding the air pollution-attributable mortality rate per 100,000 population in T2DM across Iran and its provinces. Among females, Gilan province exhibited the highest AAPC (4.427; 95% UI: 4.305, 4.535), whereas Lorestan recorded the lowest (0.346; 95% UI: 0.253, 0.402). Similarly, in males, Bushehr province showed the most significant increase (AAPC: 4.125; 95% UI: 3.873, 4.320), while Qom province had the minimum AAPC (0.342; 95% UI: 0.210, 0.459).
Table 3: The average annual percent change in mortality rate per 100,000 population in T2DM attributable to air pollution in Iran and its provinces over 1990–2021.
| Provinces | Average annual percent change (95% UI) | |
| Female | Male | |
| Iran | 1.178 (1.104, 1.228) | 1.520 (1.440, 1.585) |
| Alborz | 1.986 (1.872, 2.069) | 1.746 (1.627, 1.850) |
| Ardebil | 1.296 (1.224, 1.363) | 2.347 (2.23, 2.451) |
| Bushehr | 3.945 (3.779, 4.103) | 4.125 (3.873, 4.320) |
| Chahar Mahal and Bakhtiari | 1.682 (1.543, 1.811) | 2.479 (2.270, 2.678) |
| East Azarbayejan | 2.906 (2.781, 3.021) | 2.839 (2.650, 3.001) |
| Fars | 3.062 (2.908, 3.200) | 3.211 (3.042, 3.361) |
| Gilan | 4.427 (4.305, 4.535) | 3.697 (3.528, 3.829) |
| Golestan | 3.544 (3.416, 3.653) | 3.675 (3.543, 3.805) |
| Hamadan | 2.043 (1.945, 2.128) | 1.947 (1.829, 2.046) |
| Hormozgan | 1.766 (1.659, 1.869) | 1.850 (1.607, 2.057) |
| Ilam | 3.575 (3.450, 3.690) | 3.888 (3.731, 4.026) |
| Isfahan | 2.847 (2.761, 2.927) | 3.034 (2.904, 3.150) |
| Kerman | 2.725 (2.604, 2.829) | 2.212 (2.088, 2.328) |
| Kermanshah | 2.342 (2.237, 2.431) | 1.822 (1.734, 1.897) |
| Khorasan-e-Razavi | 3.033 (2.936, 3.138) | 3.059 (2.922, 3.179) |
| Khuzestan | 1.839 (1.736, 1.920) | 1.647 (1.532, 1.761) |
| Kohgiluyeh and Boyer-Ahmad | 0.837 (0.765, 0.898) | 0.971 (0.855, 1.064) |
| Kurdistan | 2.356 (2.209, 2.478) | 1.901 (1.727, 2.062) |
| Lorestan | 0.346 (0.253, 0.402) | 1.341 (1.259, 1.407) |
| Markazi | 2.384 (2.233, 2.509) | 2.085 (1.887, 2.249) |
| Mazandaran | 2.046 (1.982, 2.095) | 2.111 (2.037, 2.191) |
| North Khorasan | 1.167 (1.080, 1.251) | 0.686 (0.580, 0.761) |
| Qazvin | 1.462 (1.375, 1.547) | 2.481 (2.344, 2.609) |
| Qom | 0.609 (0.493, 0.719) | 0.342 (0.210, 0.459) |
| Semnan | 2.545 (2.390, 2.682) | 2.712 (2.545, 2.864) |
| Sistan and Baluchistan | 3.478 (3.172, 3.679) | 3.107 (2.918, 3.276) |
| South Khorasan | 1.233 (1.128, 1.319) | 0.789 (0.706, 0.866) |
| Tehran | -0.505 (-0.555, -0.466) | 0.018 (-0.051, 0.095) |
| West Azarbayejan | 3.431 (3.305, 3.543) | 3.016 (2.896, 3.126) |
| Yazd | 3.222 (3.032, 3.387) | 2.999 (2.737, 3.204) |
| Zanjan | 2.685 (2.541, 2.803) | 3.313 (3.178, 3.437) |
Geographic Analysis Results
The air pollution-related diabetes mortality rates in Iranian provinces in 2021 are shown in Figure 2. The highest rates in both sexes were observed in Golestan, Mazandaran, Tehran, Yazd, Isfahan, and Khuzestan. The lowest rates in both sexes were in Hamadan, Kohgiluyeh and Boyer-Ahmad, Kurdistan, South Khorasan, and Zanjan. The highest rates among women were observed in Tehran and Khuzestan (9.0 and 6.7 per 100,000, respectively), while the lowest rates were recorded in Zanjan and Kohgiluyeh and Boyer-Ahmad (1.1 and 1.3 per 100,000, respectively). Among men, the highest rates were found in Tehran and Khuzestan (7.9 and 5.1 per 100,000, respectively), and the lowest rates were in Kohgiluyeh and Boyer-Ahmad and Hamadan (1.1 and 1.2 per 100,000, respectively).
The air pollution-related diabetes mortality rates in Iranian provinces in 2021 are shown in Figure 2. The highest rates in both sexes were observed in Golestan, Mazandaran, Tehran, Yazd, Isfahan, and Khuzestan. The lowest rates in both sexes were in Hamadan, Kohgiluyeh and Boyer-Ahmad, Kurdistan, South Khorasan, and Zanjan. The highest rates among women were observed in Tehran and Khuzestan (9.0 and 6.7 per 100,000, respectively), while the lowest rates were recorded in Zanjan and Kohgiluyeh and Boyer-Ahmad (1.1 and 1.3 per 100,000, respectively). Among men, the highest rates were found in Tehran and Khuzestan (7.9 and 5.1 per 100,000, respectively), and the lowest rates were in Kohgiluyeh and Boyer-Ahmad and Hamadan (1.1 and 1.2 per 100,000, respectively).
Figure 2: Geographic distribution of air pollution-related diabetes mortality rates by gender in Iran, 2021 (per 100,000 population).
Discussion
Overall trends and biological plausibility
This study, based on Global Burden of Disease (GBD) 2021 estimates, demonstrates a substantial three-decade increase (1990–2021) in age-standardized mortality rates attributable to air pollution among individuals with type 2 diabetes mellitus (T2DM) in Iran, followed by a noticeable decline between 2019 and 2021. Together with persistent sex differences and marked provincial variation, these findings highlight the significant contribution of ambient air pollution to diabetes-related mortality in a middle-income country undergoing rapid urbanization and industrial expansion. Our findings are consistent with previous epidemiological evidence. Cohort studies examining the relationship between diabetes mellitus and air pollution have demonstrated that exposure to air pollutants elevates the prevalence of diabetes mellitus 22. The 2019 Burden of Disease Study indicated that approximately 20% of the global diabetes burden in 2019 was attributable to particulate matter 2.5 (PM2.5) air pollution 23. Moreover, evidence from a 12-year longitudinal cohort study in China indicated that long-term exposure to ambient air pollution is significantly associated with an increased risk of diabetes onset and heightened mortality within this patient population. Specifically, PM10, SO₂, and NO₂ were associated with markedly higher diabetes incidence, while PM10 showed the strongest association with diabetes-related mortality, followed by NO₂ and SO₂. 24. These findings provide context for the observed trends in Iran and set the stage for understanding the underlying biological mechanisms. Chronic exposure to air pollutants such as PM2.5, PM10, and gaseous pollutants contributes to T2DM development through mechanisms involving systemic inflammation, oxidative stress, and endoplasmic reticulum dysfunction 25. Inhaled pollutants trigger pulmonary oxidative stress and the systemic release of pro-inflammatory cytokines 26, 27, activating pathways such as NF-κB that impair insulin signaling and promote insulin resistance28. Additional pathways include visceral adipose tissue inflammation, macrophage infiltration, and mitochondrial dysfunction following long-term PM2.5 exposure 29, 30, collectively disrupting glucose homeostasis and increasing cardiovascular and premature mortality risk in diabetes1. Experimental evidence indicates that PM2.5 penetrates deeply into the alveoli and generates reactive oxygen species more potently than larger particles 31, which may help explain rising pollution-attributable T2DM mortality in high-exposure settings such as Iran32, 33.
Air pollution trends
Field studies indicate a dramatic global increase in air pollution, with the WHO reporting in 2019 that 99% of the global population is exposed to ambient air pollution that exceeds WHO guideline limits, with a disproportionate burden observed in low- and middle-income countries 34, 35. In Iran, pollutant concentrations have intensified since the 1970s owing to industrialization, vehicular emissions, and dust storms, reaching critical levels in cities such as Tehran, Ahvaz, Mashhad, and Isfahan 18, where Ahvaz has ranked among the world's most polluted cities, with particulate concentrations sometimes threefold that of Beijing 36. This severe pollution is consistent with the observed three-decade rise in attributable T2DM deaths in Iran.
Impact of COVID-19
Another key finding of the present study was the observed decline in mortality rates between 2019 and 2021, following three decades of increasing trends. This period coincided with global lockdowns and restrictions due to the COVID-19 pandemic, which also affected Iran 37. Multiple studies have documented a notable improvement in air quality during this time. For example, the Air Quality Index (AQI) in Tehran decreased by 8% in the first four months of 2020 compared to the same period in 2016–2019 38, and major pollutants, including PM10, CO, SO₂, and NO₂, showed significant reductions during March–April 2020 relative to 2019 39. Overall, the three-phase lockdown initiated in early 2020 led to a substantial drop in concentrations of PM10, SO₂, CO, and other pollutants, with improvements persisting into early 2021. However, as restrictions were gradually lifted and normal activities resumed, pollution levels began to rise again 40, 41.
Gender Differences
A consistent gender disparity was observed, with age-standardized mortality rates in female patients with diabetes significantly exceeding those of their male counterparts across the entire temporal range.
Research shows that women experience higher disability-adjusted life years (DALYs) and mortality rates attributable to air pollution, particularly from ambient particulate matter pollution (APMP) and household air pollution from solid fuels (HAP-SF), compared to men. This trend is observed globally and spans various age groups, with older adults being especially vulnerable 42. This higher mortality rate due to air pollution in women in Iran could have various causes. The results of studies show that women, especially in low- and middle-income countries, spend more time at home and are usually responsible for cooking. Therefore, compared to men, they spend more hours of their lives exposed to indoor air pollution and suffer more damage 43. Furthermore, women are more susceptible to air pollution because of certain biological factors. Research suggests that women have smaller lungs and narrower airways, which heighten their risk of lung diseases and damage caused by smoking and air pollution 44, 45. Additionally, studies indicate that estrogen, particularly 17β-estradiol, plays a complex role in influencing the body's inflammatory response to environmental pollutants such as ozone, potentially amplifying the inflammatory reaction in women's lungs when exposed to ozone in polluted air 46. These combined behavioral and biological factors may increase vulnerability to air pollution–related complications among women with diabetes in Iran.
Provincial Disparities and Environmental Contributors
This study shows substantial regional differences in air pollution-related T2DM mortality in Iran from 1990 to 2021. Provinces such as Gilan (for females) and Bushehr (for males) exhibited higher APC values, indicating faster increases in mortality, whereas Lorestan and Qom showed slower rises. These differences reflect a combination of industrialization, urban development, climatic conditions, and topography 47-50. Bushehr, with major gas and petrochemical industries, has high PM2.5 levels that exacerbate health risks 48. Gilan’s proximity to the Caspian Sea and humid climate may enhance pollutant retention, while Lorestan’s mountains and Qom’s arid climate facilitate dispersion or reduce particle retention 47, 49, 50. In 2021, Tehran and Khuzestan had the highest air pollution-related T2DM mortality rates, whereas Zanjan, Kohgiluyeh and Boyer-Ahmad, and Hamadan recorded the lowest. These patterns correspond partly to baseline diabetes prevalence, climate, industrialization, urbanization, and lifestyle factors13, 14, 51-54. Khuzestan, characterized by oil refineries, petrochemical plants, and frequent dust storms, has one of the highest diabetes prevalence rates (~15.3%) and elevated exposure to pollutants 13, 14. Yazd and Isfahan, both arid and industrial with natural dust exposure, also show high prevalence and mortality, where hot, dry climates and lower physical activity may amplify risk 14, 52-54. In contrast, mountainous or rural provinces experience lower pollution exposure and reduced diabetes burden 49, 50. Tehran, Iran’s capital, frequently exceeds WHO limits for PM2.5 and NO2, particularly during colder months due to temperature inversions. High population density, vehicular emissions, and industrial activities worsen air quality, while urbanization further increases concentrations of PM2.5, PM10, NO2, and SO2 55-59. Khuzestan’s industrial activities release VOCs, greenhouse gases, and particulate matter, compounded by dust storms, which contribute to respiratory, cardiovascular, and diabetes-related complications 1, 51, 60, 61. Overall, these findings underscore the need for geographically tailored public health strategies. Targeted interventions in high-burden provinces, including pollution control, diabetes screening, and lifestyle modification programs, could mitigate the impact of environmental and industrial contributors on T2DM mortality.
Strengths and limitations
The primary strengths of this study lie in its novelty, as it represents the first analysis of sex-stratified and province-specific mortality trends in T2DM linked to air pollution within the Iranian context. Furthermore, the utilization of the GBD database ensures a high level of granularity and statistical power, providing critical insights that can assist in assessing the efficacy of the national healthcare system.
However, several limitations must be acknowledged. First, the study is primarily descriptive in nature, focusing on the characterization of temporal trends rather than identifying the causal determinants or biological mechanisms through explanatory variables or predictive modeling. Second, the reliance on GBD-sourced data introduces potential biases stemming from heterogeneous data collection methods and the use of statistical estimates in regions with limited primary data. In contexts such as Iran, where vital registration systems may be suboptimal, the risks of underreporting and measurement errors remain a significant concern 62. Moreover, relying on estimated data for countries with limited information can influence the accuracy of national projections.
Conclusion
This study highlights the substantial impact of air pollution on type 2 diabetes mellitus (T2DM) mortality in Iran from 1990 to 2021. The key findings include a steady increase in age-standardized mortality rates until 2019, followed by a decline from 2019 to 2021 (likely due to COVID-19 lockdowns), alongside persistent sex disparities (higher in women) and marked provincial variations (highest in Tehran and Khuzestan, lowest in mountainous regions). These results indicate that air pollution remains a major preventable driver of diabetes-related mortality, exacerbating cardiovascular and metabolic burdens in high-exposure areas.
Policymakers should prioritize high-burden provinces with targeted interventions, such as stricter pollution controls (industrial/vehicular emissions and dust storm mitigation), enhanced diabetes screening and prevention, and promotion of lifestyle changes (especially physical activity). Geographically tailored national and provincial strategies are urgently needed to reduce this ongoing health burden in Iran.
Data availability statement
The datasets are freely available in the Global Burden of Disease Study (GBD) repository, [https://vizhub.healthdata.org/gbd-results/].
Use of generative AI and AI-assisted technologies
During preparation, the authors used AI to assist with grammar checking and enhance the academic quality of the manuscript. After using this tool, the authors reviewed and edited the manuscript.
Acknowledgements
The authors have no acknowledgements to declare.
Conflict of Interest
The authors declare that they have no competing interests.
Funding
This research received no specific grant from any funding agency in the public, commercial, or not-for-profit sectors.
Ethical Considerations
This study used aggregated publicly available GBD data and did not require informed consent. All procedures were performed in accordance with relevant guidelines and regulations.
Code of Ethics
This study was approved by the Ethics Committee of Shahid Sadoughi University of Medical Sciences (Ethics Code: IR.SSU.REC.1403.134).
Authors' Contributions
S.H. and M.TS. conceived the idea. N.H. and S.H. contributed to designing the study. M.TS. collected the data. F.SS. and M.TS. analyzed the data. N.H., S.H., and F.SS. wrote the draft of the manuscript. Subsequently, all authors engaged in discussions regarding the results and provided feedback on the manuscript draft, and N.H. and F.SS. revised and finalized the draft of the manuscript based on the authors’ comments.
This is an Open-Access article distributed in accordance with the terms of the Creative Commons Attribution (CC BY 4.0) license, which permits others to distribute, remix, adapt, and build upon this work for commercial use.
References
1. Bonanni LJ, Wittkopp S, Long C, et al. A review of air pollution as a driver of cardiovascular disease risk across the diabetes spectrum. Front Endocrinol (Lausanne). 2024;15:1321323.
2. Mahgoub MO, Ali II, Adeghate JO, et al. An update on the molecular and cellular basis of pharmacotherapy in type 2 diabetes mellitus. Int J Mol Sci. 2023;24(11):9328.
3. Zhu R, Zhou S, Xia L, et al. Incidence, morbidity and years lived with disability due to type 2 diabetes mellitus in 204 countries and territories: trends from 1990 to 2019. Front Endocrinol (Lausanne). 2022;13:905538.
4. Abdul Basith Khan M, Hashim MJ, King JK, et al. Epidemiology of type 2 diabetes—global burden of disease and forecasted trends. J Epidemiol Glob Health. 2020;10(1):107-11.
5. Yu M, Zhan X, Yang Z, et al. Measuring the global, regional, and national burden of type 2 diabetes and the attributable risk factors in all 194 countries. J Diabetes. 2021;13(8):613-39.
6. Beulens JW, Pinho MG, Abreu TC, et al. Environmental risk factors of type 2 diabetes—An exposome approach. Diabetologia. 2022;65(2):263-74.
7. Dendup T, Feng X, Clingan S, et al. Environmental risk factors for developing type 2 diabetes mellitus: a systematic review. Int J Environ Res Public Health. 2018;15(1):78.
8. Dehghani S, Oskoei V, Yazdi NB, et al. A comprehensive review of the relationship between air pollution and type 2 diabetes. Diseases and Health Consequences of Air Pollution. 2024:189-207.
9. Fan C, Wang W, Wang S, et al. Multiple dietary patterns and the association between long-term air pollution exposure with type 2 diabetes risk: Findings from UK Biobank cohort study. Ecotoxicol Environ Saf. 2024;275:116274.
10. Eze IC, Hemkens LG, Bucher HC, et al. Association between ambient air pollution and diabetes mellitus in Europe and North America: systematic review and meta-analysis. Environ Health Perspect. 2015;123(5):381-9.
11. Li C, Fang D, Xu D, et al. Mechanisms in endocrinology: main air pollutants and diabetes-associated mortality: a systematic review and meta-analysis. Eur J Endocrinol. 2014; 171(5): R183-R90.
12. Lim CC, Hayes RB, Ahn J, et al. Association between long-term exposure to ambient air pollution and diabetes mortality in the US. Environ Res. 2018;165:330-6.
13. Hariri S, Rahimi Z, Hashemi-Madani N, et al. Prevalence and determinants of diabetes and prediabetes in southwestern Iran: the Khuzestan comprehensive health study (KCHS). BMC Endocr Disord. 2021;21(1):1-11.
14. Hazar N, Jokar M, Namavari N, et al. An updated systematic review and Meta-analysis of the prevalence of type 2 diabetes in Iran, 1996–2023. Front Public Health. 2024;12:1322072.
15. Khamseh ME, Sepanlou SG, Hashemi-Madani N, et al. Nationwide prevalence of diabetes and prediabetes and associated risk factors among Iranian adults: analysis of data from PERSIAN cohort study. Diabetes Therapy. 2021;12:2921-38.
16. Khodakarami R, Abdi Z, Ahmadnezhad E, et al. Prevalence, awareness, treatment and control of diabetes among Iranian population: results of four national cross-sectional STEPwise approach to surveillance surveys. BMC Public Health. 2022;22(1):1216.
17. Mohammadi M, Raiegani AAV, Jalali R, et al. The prevalence of retinopathy among type 2 diabetic patients in Iran: A systematic review and meta-analysis. Rev Endocr Metab Disord. 2019;20:79-88.
18. Ghorani-Azam A, Riahi-Zanjani B, Balali-Mood M. Effects of air pollution on human health and practical measures for prevention in Iran. Journal of Research in Medical Sciences. 2016;21(1):65.
19. Taheri Soodejani M. Five Common Cancers in Iran in 2019: Secondary Analysis to Discovering Cluster of Cancers. J Prim Care Community Health. 2023;14:21501319231186923.
20. Ferrari AJ, Santomauro DF, Aali A, et al. Global incidence, prevalence, years lived with disability (YLDs), disability-adjusted life-years (DALYs), and healthy life expectancy (HALE) for 371 diseases and injuries in 204 countries and territories and 811 subnational locations, 1990–2021: a systematic analysis for the Global Burden of Disease Study 2021. The Lancet. 2024;403(10440):2133-61.
21. Global Burden of Disease Collaborative Network. Global Burden of Disease Study 2019 (GBD 2019) Results. Seattle, WA: Institute for Health Metrics and Evaluation (IHME); 2020. Available from: https://vizhub.healthdata.org/gbd-results/. [cited Jul 17, 2020].
22. Renzi M, Cerza F, Gariazzo C, et al. Air pollution and occurrence of type 2 diabetes in a large cohort study. Environ Int. 2018;112:68-76.
23. Burkart K, Causey K, Cohen AJ, et al. Estimates, trends, and drivers of the global burden of type 2 diabetes attributable to PM2·5 air pollution, 1990–2019: an analysis of data from the Global Burden of Disease Study 2019. Lancet Planet Health. 2022;6(7):e586-e600.
24. Shan A, Zhang Y, Zhang L-w, et al. Associations between the incidence and mortality rates of type 2 diabetes mellitus and long-term exposure to ambient air pollution: a 12-year cohort study in northern China. Environ Res. 2020;186:109551.
25. Li Y, Xu L, Shan Z, et al. Association between air pollution and type 2 diabetes: an updated review of the literature. Ther Adv Endocrinol Metab. 2019;10:2042018819897046.
26. Araujo JA. Particulate air pollution, systemic oxidative stress, inflammation, and atherosclerosis. Air Qual Atmos Health. 2011;4(1):79-93.
27. Valacchi G, Magnani N, Woodby B, et al. Particulate matter induces tissue oxinflammation: from mechanism to damage. Antioxid Redox Signal. 2020;33(4):308-26.
28. Młynarska E, Grabarczyk M, Leszto K, et al. Environmental insults to glucose metabolism: the role of pollutants in insulin resistance. Int J Mol Sci. 2025;26(18):8979.
29. Sun Q, Yue P, Deiuliis JA, et al. Ambient air pollution exaggerates adipose inflammation and insulin resistance in a mouse model of diet-induced obesity. Circulation. 2009;119(4):538-46.
30. Xu X, Liu C, Xu Z, et al. Long-term exposure to ambient fine particulate pollution induces insulin resistance and mitochondrial alteration in adipose tissue. Toxicological Sciences. 2011;124(1):88-98.
31. Xing Y-F, Xu Y-H, Shi M-H, et al. The impact of PM2. 5 on the human respiratory system. J Thorac Dis. 2016;8(1):E69.
32. Abbasi-Kangevari M, Malekpour M-R, Masinaei M, et al. Effect of air pollution on disease burden, mortality, and life expectancy in North Africa and the Middle East: a systematic analysis for the global burden of disease study 2019. Lancet Planet Health. 2023;7(5):e358-e69.
33. Talepour N, Birgani YT, Kelly FJ, et al. Ambient PM2. 5: Health policy implications and management in Khuzestan, Iran. Sci Total Environ. 2025;1004:180767.
34. World Health Organization. Air pollution [Internet]. Geneva: World Health Organization; [updated date unknown; cited 2024 Mar 10]. Available from: https://www.who.int/health-topics/air-pollution#tab=tab_1. [cited Mar 10, 2024].
35. World Health Organization. Ambient (outdoor) air quality and health [Internet]. Geneva: World Health Organization; [updated 2022 Sep 22; cited 2024 Mar 10]. Available from: https://www.who.int/news-room/fact-sheets/detail/ambient-(outdoor)-air-quality-and-health. [cited 2024 Mar 10]
36. Mawer C. Air pollution in Iran. Bmj. 2014;348.
37. Delavari S, Jamali Z, Bayati M. Lockdown effect on COVID-19 incidence and death: Iran experience. Disaster Med Public Health Prep. 2022;16(6):2385-7.
38. Yazdani M, Baboli Z, Maleki H, et al. Contrasting Iran’s air quality improvement during COVID-19 with other global cities. J Environ Health Sci Eng. 2021;19(2):1801-6.
39. Broomandi P, Karaca F, Nikfal A, et al. Impact of COVID-19 event on the air quality in Iran. Aerosol Air Qual Res. 2020;20(8):1793-804.
40. Bagherinia M, Bodaghpour S, Karimi N, et al. Spatio-temporal air quality assessment in Tehran, Iran, during the COVID-19 lockdown periods. Geocarto Int. 2023:2169374.
41. Tondelli S, Farhadi E, Akbari Monfared B, et al. Air quality and environmental effects due to COVID-19 in Tehran, Iran: lessons for sustainability. Sustainability. 2022;14(22):15038.
42. Yi Q, Liu M, Yan D, et al. Particulate matter pollution and older adult health: global trends and disparities, 1991–2021. Front Public Health. 2024;12:1478860.
43. Sukhsohale ND, Narlawar UW, Phatak MS. Indoor air pollution from biomass combustion and its adverse health effects in central India: an exposure-response study. Indian Journal of Community Medicine. 2013;38(3):162-7.
44. Clougherty JE. A growing role for gender analysis in air pollution epidemiology. Environ Health Perspect. 2010;118(2):167-76.
45. Dominelli PB, Ripoll JG, Cross TJ, et al. Sex differences in large conducting airway anatomy. J Appl Physiol. 2018;125(3):960-5.
46. Fuentes N, Nicoleau M, Cabello N, et al. 17β-Estradiol affects lung function and inflammation following ozone exposure in a sex-specific manner. Am J Physiol Lung Cell Mol Physiol. 2019;317(5):L702-L16.
47. Azimi N. Process of urban development and its environmental impacts on the Southern Caspian Sea region. Caspian Journal of Environmental Sciences. 2003;1(1):1-7.
48. Faridi S, Bayat R, Cohen AJ, et al. Health burden and economic loss attributable to ambient PM2. 5 in Iran based on the ground and satellite data. Sci Rep. 2022;12(1):14386.
49. Fouladi Fard R, Naddafi K, Hassanvand MS, et al. Trends of metals enrichment in deposited particulate matter at semi-arid area of Iran. Environ Sci Pollut Res Int. 2018;25:18737-51.
50. Triantafyllou A, Kassomenos P. Aspects of atmospheric flow and dispersion of air pollutants in a mountainous basin. Sci Total Environ. 2002;297(1-3):85-103.
51. Aghababaeian H, Ostadtaghizadeh A, Ardalan A, et al. Effect of dust storms on Non-Accidental, cardiovascular, and respiratory mortality: A Case of Dezful City in Iran. Environ Health Insights. 2021;15:11786302211060152.
52. Dehghani A, Korozhdehi H, Hossein Khalilzadeh S, et al. Prevalence of diabetes and its correlates among Iranian adults: Results of the first phase of Shahedieh cohort study. Health Sci Rep. 2023;6(4):e1170.
53. Guo C, Yang HT, Chang L-y, et al. Habitual exercise is associated with reduced risk of diabetes regardless of air pollution: a longitudinal cohort study. Diabetologia. 2021;64(6):1298-308.
54. Nejadghaderi SA, Ahmadi N, Rashidi M-M, et al. Physical activity pattern in Iran: findings from STEPS 2021. Front Public Health. 2023; 10: 1036219.
55. Golbaz S, Farzadkia M, Kermani M. Determination of Tehran air quality with emphasis on air quality index (AQI) 2008-2009. Iran Occupational Health. 2010;6(4):62-8.
56. Kermani M, Dowlati M, Jonidi Jafari A, et al. Estimation of mortality, acute myocardial infarction and chronic obstructive pulmonary disease due to exposure to O3, NO2, and SO2 in ambient air in Tehran. Journal of Mazandaran University of Medical Sciences. 2016;26(138):96-107.
57. Lelieveld J, Barlas C, Giannadaki D, et al. Model calculated global, regional and megacity premature mortality due to air pollution. Atmos Chem Phys. 2013;13(14):7023-37.
58. Maji S, Ahmed S, Kaur-Sidhu M, et al. Health risks of major air pollutants, their drivers and mitigation strategies: a review. Air, Soil and Water Research. 2023;16:11786221231154659.
59. Taghizadeh F, Jafari AJ, Kermani M. The trend of air quality index (AQI) in Tehran during (2011-2016). Journal of Air pollution and Health. 2019;4(3):187-92.
60. Ragothaman A, Anderson WA. Air quality impacts of petroleum refining and petrochemical industries. Environments. 2017;4(3):66.
61. Zona A, Iavarone I, Buzzoni C, et al. SENTIERI: Epidemiological study of residents in national priority contaminated sites. Fifth report. Epidemiol Prev. 2019;43(2-3 Suppl 1):1-208.
62. Soodejani MT, Shamsi FS. Time trend and geographical distribution of major depressive disorder in Iran, 1990 to 2021: results from the Global Burden of Disease Study. BMJ Open. 2025;15(10):e095730.
Overall trends and biological plausibility
This study, based on Global Burden of Disease (GBD) 2021 estimates, demonstrates a substantial three-decade increase (1990–2021) in age-standardized mortality rates attributable to air pollution among individuals with type 2 diabetes mellitus (T2DM) in Iran, followed by a noticeable decline between 2019 and 2021. Together with persistent sex differences and marked provincial variation, these findings highlight the significant contribution of ambient air pollution to diabetes-related mortality in a middle-income country undergoing rapid urbanization and industrial expansion. Our findings are consistent with previous epidemiological evidence. Cohort studies examining the relationship between diabetes mellitus and air pollution have demonstrated that exposure to air pollutants elevates the prevalence of diabetes mellitus 22. The 2019 Burden of Disease Study indicated that approximately 20% of the global diabetes burden in 2019 was attributable to particulate matter 2.5 (PM2.5) air pollution 23. Moreover, evidence from a 12-year longitudinal cohort study in China indicated that long-term exposure to ambient air pollution is significantly associated with an increased risk of diabetes onset and heightened mortality within this patient population. Specifically, PM10, SO₂, and NO₂ were associated with markedly higher diabetes incidence, while PM10 showed the strongest association with diabetes-related mortality, followed by NO₂ and SO₂. 24. These findings provide context for the observed trends in Iran and set the stage for understanding the underlying biological mechanisms. Chronic exposure to air pollutants such as PM2.5, PM10, and gaseous pollutants contributes to T2DM development through mechanisms involving systemic inflammation, oxidative stress, and endoplasmic reticulum dysfunction 25. Inhaled pollutants trigger pulmonary oxidative stress and the systemic release of pro-inflammatory cytokines 26, 27, activating pathways such as NF-κB that impair insulin signaling and promote insulin resistance28. Additional pathways include visceral adipose tissue inflammation, macrophage infiltration, and mitochondrial dysfunction following long-term PM2.5 exposure 29, 30, collectively disrupting glucose homeostasis and increasing cardiovascular and premature mortality risk in diabetes1. Experimental evidence indicates that PM2.5 penetrates deeply into the alveoli and generates reactive oxygen species more potently than larger particles 31, which may help explain rising pollution-attributable T2DM mortality in high-exposure settings such as Iran32, 33.
Air pollution trends
Field studies indicate a dramatic global increase in air pollution, with the WHO reporting in 2019 that 99% of the global population is exposed to ambient air pollution that exceeds WHO guideline limits, with a disproportionate burden observed in low- and middle-income countries 34, 35. In Iran, pollutant concentrations have intensified since the 1970s owing to industrialization, vehicular emissions, and dust storms, reaching critical levels in cities such as Tehran, Ahvaz, Mashhad, and Isfahan 18, where Ahvaz has ranked among the world's most polluted cities, with particulate concentrations sometimes threefold that of Beijing 36. This severe pollution is consistent with the observed three-decade rise in attributable T2DM deaths in Iran.
Impact of COVID-19
Another key finding of the present study was the observed decline in mortality rates between 2019 and 2021, following three decades of increasing trends. This period coincided with global lockdowns and restrictions due to the COVID-19 pandemic, which also affected Iran 37. Multiple studies have documented a notable improvement in air quality during this time. For example, the Air Quality Index (AQI) in Tehran decreased by 8% in the first four months of 2020 compared to the same period in 2016–2019 38, and major pollutants, including PM10, CO, SO₂, and NO₂, showed significant reductions during March–April 2020 relative to 2019 39. Overall, the three-phase lockdown initiated in early 2020 led to a substantial drop in concentrations of PM10, SO₂, CO, and other pollutants, with improvements persisting into early 2021. However, as restrictions were gradually lifted and normal activities resumed, pollution levels began to rise again 40, 41.
Gender Differences
A consistent gender disparity was observed, with age-standardized mortality rates in female patients with diabetes significantly exceeding those of their male counterparts across the entire temporal range.
Research shows that women experience higher disability-adjusted life years (DALYs) and mortality rates attributable to air pollution, particularly from ambient particulate matter pollution (APMP) and household air pollution from solid fuels (HAP-SF), compared to men. This trend is observed globally and spans various age groups, with older adults being especially vulnerable 42. This higher mortality rate due to air pollution in women in Iran could have various causes. The results of studies show that women, especially in low- and middle-income countries, spend more time at home and are usually responsible for cooking. Therefore, compared to men, they spend more hours of their lives exposed to indoor air pollution and suffer more damage 43. Furthermore, women are more susceptible to air pollution because of certain biological factors. Research suggests that women have smaller lungs and narrower airways, which heighten their risk of lung diseases and damage caused by smoking and air pollution 44, 45. Additionally, studies indicate that estrogen, particularly 17β-estradiol, plays a complex role in influencing the body's inflammatory response to environmental pollutants such as ozone, potentially amplifying the inflammatory reaction in women's lungs when exposed to ozone in polluted air 46. These combined behavioral and biological factors may increase vulnerability to air pollution–related complications among women with diabetes in Iran.
Provincial Disparities and Environmental Contributors
This study shows substantial regional differences in air pollution-related T2DM mortality in Iran from 1990 to 2021. Provinces such as Gilan (for females) and Bushehr (for males) exhibited higher APC values, indicating faster increases in mortality, whereas Lorestan and Qom showed slower rises. These differences reflect a combination of industrialization, urban development, climatic conditions, and topography 47-50. Bushehr, with major gas and petrochemical industries, has high PM2.5 levels that exacerbate health risks 48. Gilan’s proximity to the Caspian Sea and humid climate may enhance pollutant retention, while Lorestan’s mountains and Qom’s arid climate facilitate dispersion or reduce particle retention 47, 49, 50. In 2021, Tehran and Khuzestan had the highest air pollution-related T2DM mortality rates, whereas Zanjan, Kohgiluyeh and Boyer-Ahmad, and Hamadan recorded the lowest. These patterns correspond partly to baseline diabetes prevalence, climate, industrialization, urbanization, and lifestyle factors13, 14, 51-54. Khuzestan, characterized by oil refineries, petrochemical plants, and frequent dust storms, has one of the highest diabetes prevalence rates (~15.3%) and elevated exposure to pollutants 13, 14. Yazd and Isfahan, both arid and industrial with natural dust exposure, also show high prevalence and mortality, where hot, dry climates and lower physical activity may amplify risk 14, 52-54. In contrast, mountainous or rural provinces experience lower pollution exposure and reduced diabetes burden 49, 50. Tehran, Iran’s capital, frequently exceeds WHO limits for PM2.5 and NO2, particularly during colder months due to temperature inversions. High population density, vehicular emissions, and industrial activities worsen air quality, while urbanization further increases concentrations of PM2.5, PM10, NO2, and SO2 55-59. Khuzestan’s industrial activities release VOCs, greenhouse gases, and particulate matter, compounded by dust storms, which contribute to respiratory, cardiovascular, and diabetes-related complications 1, 51, 60, 61. Overall, these findings underscore the need for geographically tailored public health strategies. Targeted interventions in high-burden provinces, including pollution control, diabetes screening, and lifestyle modification programs, could mitigate the impact of environmental and industrial contributors on T2DM mortality.
Strengths and limitations
The primary strengths of this study lie in its novelty, as it represents the first analysis of sex-stratified and province-specific mortality trends in T2DM linked to air pollution within the Iranian context. Furthermore, the utilization of the GBD database ensures a high level of granularity and statistical power, providing critical insights that can assist in assessing the efficacy of the national healthcare system.
However, several limitations must be acknowledged. First, the study is primarily descriptive in nature, focusing on the characterization of temporal trends rather than identifying the causal determinants or biological mechanisms through explanatory variables or predictive modeling. Second, the reliance on GBD-sourced data introduces potential biases stemming from heterogeneous data collection methods and the use of statistical estimates in regions with limited primary data. In contexts such as Iran, where vital registration systems may be suboptimal, the risks of underreporting and measurement errors remain a significant concern 62. Moreover, relying on estimated data for countries with limited information can influence the accuracy of national projections.
Conclusion
This study highlights the substantial impact of air pollution on type 2 diabetes mellitus (T2DM) mortality in Iran from 1990 to 2021. The key findings include a steady increase in age-standardized mortality rates until 2019, followed by a decline from 2019 to 2021 (likely due to COVID-19 lockdowns), alongside persistent sex disparities (higher in women) and marked provincial variations (highest in Tehran and Khuzestan, lowest in mountainous regions). These results indicate that air pollution remains a major preventable driver of diabetes-related mortality, exacerbating cardiovascular and metabolic burdens in high-exposure areas.
Policymakers should prioritize high-burden provinces with targeted interventions, such as stricter pollution controls (industrial/vehicular emissions and dust storm mitigation), enhanced diabetes screening and prevention, and promotion of lifestyle changes (especially physical activity). Geographically tailored national and provincial strategies are urgently needed to reduce this ongoing health burden in Iran.
Data availability statement
The datasets are freely available in the Global Burden of Disease Study (GBD) repository, [https://vizhub.healthdata.org/gbd-results/].
Use of generative AI and AI-assisted technologies
During preparation, the authors used AI to assist with grammar checking and enhance the academic quality of the manuscript. After using this tool, the authors reviewed and edited the manuscript.
Acknowledgements
The authors have no acknowledgements to declare.
Conflict of Interest
The authors declare that they have no competing interests.
Funding
This research received no specific grant from any funding agency in the public, commercial, or not-for-profit sectors.
Ethical Considerations
This study used aggregated publicly available GBD data and did not require informed consent. All procedures were performed in accordance with relevant guidelines and regulations.
Code of Ethics
This study was approved by the Ethics Committee of Shahid Sadoughi University of Medical Sciences (Ethics Code: IR.SSU.REC.1403.134).
Authors' Contributions
S.H. and M.TS. conceived the idea. N.H. and S.H. contributed to designing the study. M.TS. collected the data. F.SS. and M.TS. analyzed the data. N.H., S.H., and F.SS. wrote the draft of the manuscript. Subsequently, all authors engaged in discussions regarding the results and provided feedback on the manuscript draft, and N.H. and F.SS. revised and finalized the draft of the manuscript based on the authors’ comments.
This is an Open-Access article distributed in accordance with the terms of the Creative Commons Attribution (CC BY 4.0) license, which permits others to distribute, remix, adapt, and build upon this work for commercial use.
References
1. Bonanni LJ, Wittkopp S, Long C, et al. A review of air pollution as a driver of cardiovascular disease risk across the diabetes spectrum. Front Endocrinol (Lausanne). 2024;15:1321323.
2. Mahgoub MO, Ali II, Adeghate JO, et al. An update on the molecular and cellular basis of pharmacotherapy in type 2 diabetes mellitus. Int J Mol Sci. 2023;24(11):9328.
3. Zhu R, Zhou S, Xia L, et al. Incidence, morbidity and years lived with disability due to type 2 diabetes mellitus in 204 countries and territories: trends from 1990 to 2019. Front Endocrinol (Lausanne). 2022;13:905538.
4. Abdul Basith Khan M, Hashim MJ, King JK, et al. Epidemiology of type 2 diabetes—global burden of disease and forecasted trends. J Epidemiol Glob Health. 2020;10(1):107-11.
5. Yu M, Zhan X, Yang Z, et al. Measuring the global, regional, and national burden of type 2 diabetes and the attributable risk factors in all 194 countries. J Diabetes. 2021;13(8):613-39.
6. Beulens JW, Pinho MG, Abreu TC, et al. Environmental risk factors of type 2 diabetes—An exposome approach. Diabetologia. 2022;65(2):263-74.
7. Dendup T, Feng X, Clingan S, et al. Environmental risk factors for developing type 2 diabetes mellitus: a systematic review. Int J Environ Res Public Health. 2018;15(1):78.
8. Dehghani S, Oskoei V, Yazdi NB, et al. A comprehensive review of the relationship between air pollution and type 2 diabetes. Diseases and Health Consequences of Air Pollution. 2024:189-207.
9. Fan C, Wang W, Wang S, et al. Multiple dietary patterns and the association between long-term air pollution exposure with type 2 diabetes risk: Findings from UK Biobank cohort study. Ecotoxicol Environ Saf. 2024;275:116274.
10. Eze IC, Hemkens LG, Bucher HC, et al. Association between ambient air pollution and diabetes mellitus in Europe and North America: systematic review and meta-analysis. Environ Health Perspect. 2015;123(5):381-9.
11. Li C, Fang D, Xu D, et al. Mechanisms in endocrinology: main air pollutants and diabetes-associated mortality: a systematic review and meta-analysis. Eur J Endocrinol. 2014; 171(5): R183-R90.
12. Lim CC, Hayes RB, Ahn J, et al. Association between long-term exposure to ambient air pollution and diabetes mortality in the US. Environ Res. 2018;165:330-6.
13. Hariri S, Rahimi Z, Hashemi-Madani N, et al. Prevalence and determinants of diabetes and prediabetes in southwestern Iran: the Khuzestan comprehensive health study (KCHS). BMC Endocr Disord. 2021;21(1):1-11.
14. Hazar N, Jokar M, Namavari N, et al. An updated systematic review and Meta-analysis of the prevalence of type 2 diabetes in Iran, 1996–2023. Front Public Health. 2024;12:1322072.
15. Khamseh ME, Sepanlou SG, Hashemi-Madani N, et al. Nationwide prevalence of diabetes and prediabetes and associated risk factors among Iranian adults: analysis of data from PERSIAN cohort study. Diabetes Therapy. 2021;12:2921-38.
16. Khodakarami R, Abdi Z, Ahmadnezhad E, et al. Prevalence, awareness, treatment and control of diabetes among Iranian population: results of four national cross-sectional STEPwise approach to surveillance surveys. BMC Public Health. 2022;22(1):1216.
17. Mohammadi M, Raiegani AAV, Jalali R, et al. The prevalence of retinopathy among type 2 diabetic patients in Iran: A systematic review and meta-analysis. Rev Endocr Metab Disord. 2019;20:79-88.
18. Ghorani-Azam A, Riahi-Zanjani B, Balali-Mood M. Effects of air pollution on human health and practical measures for prevention in Iran. Journal of Research in Medical Sciences. 2016;21(1):65.
19. Taheri Soodejani M. Five Common Cancers in Iran in 2019: Secondary Analysis to Discovering Cluster of Cancers. J Prim Care Community Health. 2023;14:21501319231186923.
20. Ferrari AJ, Santomauro DF, Aali A, et al. Global incidence, prevalence, years lived with disability (YLDs), disability-adjusted life-years (DALYs), and healthy life expectancy (HALE) for 371 diseases and injuries in 204 countries and territories and 811 subnational locations, 1990–2021: a systematic analysis for the Global Burden of Disease Study 2021. The Lancet. 2024;403(10440):2133-61.
21. Global Burden of Disease Collaborative Network. Global Burden of Disease Study 2019 (GBD 2019) Results. Seattle, WA: Institute for Health Metrics and Evaluation (IHME); 2020. Available from: https://vizhub.healthdata.org/gbd-results/. [cited Jul 17, 2020].
22. Renzi M, Cerza F, Gariazzo C, et al. Air pollution and occurrence of type 2 diabetes in a large cohort study. Environ Int. 2018;112:68-76.
23. Burkart K, Causey K, Cohen AJ, et al. Estimates, trends, and drivers of the global burden of type 2 diabetes attributable to PM2·5 air pollution, 1990–2019: an analysis of data from the Global Burden of Disease Study 2019. Lancet Planet Health. 2022;6(7):e586-e600.
24. Shan A, Zhang Y, Zhang L-w, et al. Associations between the incidence and mortality rates of type 2 diabetes mellitus and long-term exposure to ambient air pollution: a 12-year cohort study in northern China. Environ Res. 2020;186:109551.
25. Li Y, Xu L, Shan Z, et al. Association between air pollution and type 2 diabetes: an updated review of the literature. Ther Adv Endocrinol Metab. 2019;10:2042018819897046.
26. Araujo JA. Particulate air pollution, systemic oxidative stress, inflammation, and atherosclerosis. Air Qual Atmos Health. 2011;4(1):79-93.
27. Valacchi G, Magnani N, Woodby B, et al. Particulate matter induces tissue oxinflammation: from mechanism to damage. Antioxid Redox Signal. 2020;33(4):308-26.
28. Młynarska E, Grabarczyk M, Leszto K, et al. Environmental insults to glucose metabolism: the role of pollutants in insulin resistance. Int J Mol Sci. 2025;26(18):8979.
29. Sun Q, Yue P, Deiuliis JA, et al. Ambient air pollution exaggerates adipose inflammation and insulin resistance in a mouse model of diet-induced obesity. Circulation. 2009;119(4):538-46.
30. Xu X, Liu C, Xu Z, et al. Long-term exposure to ambient fine particulate pollution induces insulin resistance and mitochondrial alteration in adipose tissue. Toxicological Sciences. 2011;124(1):88-98.
31. Xing Y-F, Xu Y-H, Shi M-H, et al. The impact of PM2. 5 on the human respiratory system. J Thorac Dis. 2016;8(1):E69.
32. Abbasi-Kangevari M, Malekpour M-R, Masinaei M, et al. Effect of air pollution on disease burden, mortality, and life expectancy in North Africa and the Middle East: a systematic analysis for the global burden of disease study 2019. Lancet Planet Health. 2023;7(5):e358-e69.
33. Talepour N, Birgani YT, Kelly FJ, et al. Ambient PM2. 5: Health policy implications and management in Khuzestan, Iran. Sci Total Environ. 2025;1004:180767.
34. World Health Organization. Air pollution [Internet]. Geneva: World Health Organization; [updated date unknown; cited 2024 Mar 10]. Available from: https://www.who.int/health-topics/air-pollution#tab=tab_1. [cited Mar 10, 2024].
35. World Health Organization. Ambient (outdoor) air quality and health [Internet]. Geneva: World Health Organization; [updated 2022 Sep 22; cited 2024 Mar 10]. Available from: https://www.who.int/news-room/fact-sheets/detail/ambient-(outdoor)-air-quality-and-health. [cited 2024 Mar 10]
36. Mawer C. Air pollution in Iran. Bmj. 2014;348.
37. Delavari S, Jamali Z, Bayati M. Lockdown effect on COVID-19 incidence and death: Iran experience. Disaster Med Public Health Prep. 2022;16(6):2385-7.
38. Yazdani M, Baboli Z, Maleki H, et al. Contrasting Iran’s air quality improvement during COVID-19 with other global cities. J Environ Health Sci Eng. 2021;19(2):1801-6.
39. Broomandi P, Karaca F, Nikfal A, et al. Impact of COVID-19 event on the air quality in Iran. Aerosol Air Qual Res. 2020;20(8):1793-804.
40. Bagherinia M, Bodaghpour S, Karimi N, et al. Spatio-temporal air quality assessment in Tehran, Iran, during the COVID-19 lockdown periods. Geocarto Int. 2023:2169374.
41. Tondelli S, Farhadi E, Akbari Monfared B, et al. Air quality and environmental effects due to COVID-19 in Tehran, Iran: lessons for sustainability. Sustainability. 2022;14(22):15038.
42. Yi Q, Liu M, Yan D, et al. Particulate matter pollution and older adult health: global trends and disparities, 1991–2021. Front Public Health. 2024;12:1478860.
43. Sukhsohale ND, Narlawar UW, Phatak MS. Indoor air pollution from biomass combustion and its adverse health effects in central India: an exposure-response study. Indian Journal of Community Medicine. 2013;38(3):162-7.
44. Clougherty JE. A growing role for gender analysis in air pollution epidemiology. Environ Health Perspect. 2010;118(2):167-76.
45. Dominelli PB, Ripoll JG, Cross TJ, et al. Sex differences in large conducting airway anatomy. J Appl Physiol. 2018;125(3):960-5.
46. Fuentes N, Nicoleau M, Cabello N, et al. 17β-Estradiol affects lung function and inflammation following ozone exposure in a sex-specific manner. Am J Physiol Lung Cell Mol Physiol. 2019;317(5):L702-L16.
47. Azimi N. Process of urban development and its environmental impacts on the Southern Caspian Sea region. Caspian Journal of Environmental Sciences. 2003;1(1):1-7.
48. Faridi S, Bayat R, Cohen AJ, et al. Health burden and economic loss attributable to ambient PM2. 5 in Iran based on the ground and satellite data. Sci Rep. 2022;12(1):14386.
49. Fouladi Fard R, Naddafi K, Hassanvand MS, et al. Trends of metals enrichment in deposited particulate matter at semi-arid area of Iran. Environ Sci Pollut Res Int. 2018;25:18737-51.
50. Triantafyllou A, Kassomenos P. Aspects of atmospheric flow and dispersion of air pollutants in a mountainous basin. Sci Total Environ. 2002;297(1-3):85-103.
51. Aghababaeian H, Ostadtaghizadeh A, Ardalan A, et al. Effect of dust storms on Non-Accidental, cardiovascular, and respiratory mortality: A Case of Dezful City in Iran. Environ Health Insights. 2021;15:11786302211060152.
52. Dehghani A, Korozhdehi H, Hossein Khalilzadeh S, et al. Prevalence of diabetes and its correlates among Iranian adults: Results of the first phase of Shahedieh cohort study. Health Sci Rep. 2023;6(4):e1170.
53. Guo C, Yang HT, Chang L-y, et al. Habitual exercise is associated with reduced risk of diabetes regardless of air pollution: a longitudinal cohort study. Diabetologia. 2021;64(6):1298-308.
54. Nejadghaderi SA, Ahmadi N, Rashidi M-M, et al. Physical activity pattern in Iran: findings from STEPS 2021. Front Public Health. 2023; 10: 1036219.
55. Golbaz S, Farzadkia M, Kermani M. Determination of Tehran air quality with emphasis on air quality index (AQI) 2008-2009. Iran Occupational Health. 2010;6(4):62-8.
56. Kermani M, Dowlati M, Jonidi Jafari A, et al. Estimation of mortality, acute myocardial infarction and chronic obstructive pulmonary disease due to exposure to O3, NO2, and SO2 in ambient air in Tehran. Journal of Mazandaran University of Medical Sciences. 2016;26(138):96-107.
57. Lelieveld J, Barlas C, Giannadaki D, et al. Model calculated global, regional and megacity premature mortality due to air pollution. Atmos Chem Phys. 2013;13(14):7023-37.
58. Maji S, Ahmed S, Kaur-Sidhu M, et al. Health risks of major air pollutants, their drivers and mitigation strategies: a review. Air, Soil and Water Research. 2023;16:11786221231154659.
59. Taghizadeh F, Jafari AJ, Kermani M. The trend of air quality index (AQI) in Tehran during (2011-2016). Journal of Air pollution and Health. 2019;4(3):187-92.
60. Ragothaman A, Anderson WA. Air quality impacts of petroleum refining and petrochemical industries. Environments. 2017;4(3):66.
61. Zona A, Iavarone I, Buzzoni C, et al. SENTIERI: Epidemiological study of residents in national priority contaminated sites. Fifth report. Epidemiol Prev. 2019;43(2-3 Suppl 1):1-208.
62. Soodejani MT, Shamsi FS. Time trend and geographical distribution of major depressive disorder in Iran, 1990 to 2021: results from the Global Burden of Disease Study. BMJ Open. 2025;15(10):e095730.
Type of Study: Original articles |
Subject:
Environmental Health, Sciences, and Engineering
Received: 2026/02/13 | Accepted: 2026/04/20 | Published: 2026/06/20
Received: 2026/02/13 | Accepted: 2026/04/20 | Published: 2026/06/20
Send email to the article author
| Rights and permissions | |
 |
This work is licensed under a Creative Commons Attribution-NonCommercial 4.0 International License. |