

Volume 2, Issue 4 (December 2017)
J Environ Health Sustain Dev 2017, 2(4): 379-387 |
Back to browse issues page


Download citation:
BibTeX | RIS | EndNote | Medlars | ProCite | Reference Manager | RefWorks
Send citation to:


BibTeX | RIS | EndNote | Medlars | ProCite | Reference Manager | RefWorks
Send citation to:
Ehrampoush M H, Jamshidi S, Zare Sakhvidi M J, Miri M. A Comparison on Function of Kriging and Inverse Distance Weighting Models in PM10 Zoning in Urban Area. J Environ Health Sustain Dev 2017; 2 (4) :379-387
URL: http://jehsd.ssu.ac.ir/article-1-90-en.html
URL: http://jehsd.ssu.ac.ir/article-1-90-en.html


Environmental Science and Technology Research Center, Department of Environmental Health Engineering, School of Public Health, Shahid Sadoughi University of Medical Sciences, Yazd, Iran.
Full-Text [PDF 923 kb]
(2087 Downloads)
| Abstract (HTML) (2788 Views)
.png)
Figure 1: The studied region and sampling points
.png)
Figure 2: The statistical summary associated with the sampling stations for PM10 in Yazd air
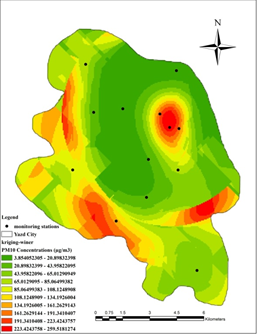
Figure 3A: PM10 Suspended particles zoning by Kriging method in winter

Figure 3B: PM10 Suspended particles zoning by IDW method in winter
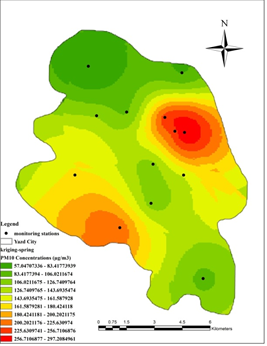
Figure 4A: PM10 Suspended particles zoning by Kriging method in spring
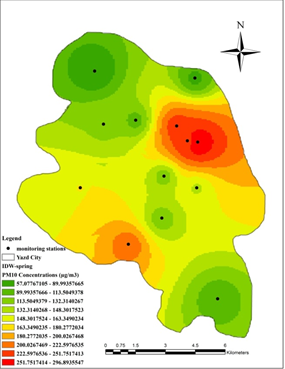
Figure 4B: PM10 Suspended particles zoning by IDW method in spring
Discussion
Spatial analysis and assessment of concentration changes on the pollutant PM10 were conducted in this study in winter and spring of 2012 and 2013. The sampling was carried out in diverse parts of the city and finally zoning was performed using IDW and Kriging interpolation methods. The mean concentration of PM10 pollutant in spring was higher than winter. Accordingly, higher pollutant concentrations were observed in high-traffic, historical regions of the city, as well as areas near the ring road. Concentration of PM10 was higher than the WHO standard (20 µg/m3) in 11 of 13 measurement stations in winter 15. Likewise in spring, seasonal concentration mean at all stations was higher than that of WHO standard. Station 9 showed a concentration that was 14.8 times higher than the WHO standard in spring. In a study conducted by Hosseinzadeh et al., in Hamedan the total average values of the suspended particles of TSO, PM10, and PM2.5 were 16, 7.72, and 4.7 times higher than the standard air quality stated in WHO regulations. The suspended particles were found to have no significant correlation with wind speed and temperature 16. Shahsavani et al., studied the dust that entered to Khouzestan province and found that in dusty days, the particles' concentration in Ahwaz increased up to 16.5 times higher than the standard value 17. In the study carried out by Nadafi et al. on Yazd air, suspended particles in spring were found to be higher than other seasons that is in line with findings of the present work 18. Moreover, Jamshidi et al., reported the highest rate of suspended particles for May and July 19.
In this study, according to RMSE percentage, Kriging model showed a desired efficiency in PM10 suspended particles zoning in Yazd air and generally showed better results in both winter and spring in zoning PM10 suspended particles. Several studies indicated that Kriging model provides a better efficiency in air pollution zoning compared to other interpolation methods 20- 23. In the study conducted by Nourpour et al. in Tehran spatial and temporal changes of pollutants such as sulfur dioxide, nitrogen dioxide, and suspended particles were determined using GIS techniques. The ability of ordinal Kriging model in using spherical semivariogram with RMSE was proved to be 17.47 times higher than other methods 9. Moreover, in the study carried out by Berman et al. , 23 to evaluate diverse models of spatial analysis for zoning concentration of ozone in the US, the rates of R2 and RMSE for IDW and Kriging models were 0.74, 8.163, 0.79, and 6.983, respectively.This indicates higher efficiency of Kriging model to zone air pollutants compared to IDW.
Conclusion
The current study showed that traffic and spatial factors are highly effective on the rate of suspended particles in air. The areas in neighborhood of main and high-traffic streets as well as historical areas with adobe structures can influence concentrations of the suspended particles. In addition, concentrations of suspended particles in winter and spring were higher than those of WHO standards. Therefore, necessary actions should be taken to prevent from harmful effects of this pollutant on residents of Yazd. Such actions are Development of public transportation, replacement of old vehicles, expansion of green space, reconstruction of the historical context of the city so that it does not produce dust, and recommendation of necessary health advices in high-polluted days. Finally, compared to IDW model, the interpolation Kriging model was proved to have higher ability in spatial analysis of suspended particles, so, it can be used in future studies.
Acknowledgements
This article was composed based on the reported data in senior thesis of Ms. Sarah Jamshidi. The authors thank everyone who contributed in this
study.
Funding
This study was funded by School of Public Health, Shahid Sadoghi University of Medical Sciences.
Conflict of interest
The authors declare that there is no conflict of interest.
This is an Open Access article distributed in accordance with the terms of the Creative Commons Attribution (CC BY 4.0) license, which permits others to distribute, remix, adapt and build upon this work, for commercial use.
References
1. De Meij A, Thunis P, Bessagnet B, et al. The sensitivity of the CHIMERE model to emissions reduction scenarios on air quality in Northern Italy. Atmos Environ. 2009; 43(11): 1897-907.
2. Downs SH, Schindler C, Liu L-JS, et al. Reduced exposure to PM10 and attenuated age-related decline in lung function. New England Journal of Medicine. 2007; 357(23): 2338-47.
3. Fattore E, Paiano V, Borgini A, et al. Human health risk in relation to air quality in two municipalities in an industrialized area of Northern Italy. Environmental research. 2011; 111(8):
1321-7.
4. Glinianaia SV, Rankin J, Bell R, et al. Particulate air pollution and fetal health: a systematic review of the epidemiologic evidence. Epidemiology. 2004; 15(1): 36-45.
5. Krzyzanowski M, Bundeshaus G, Negru ML, et al. Particulate matter air pollution: how it
harms health. World Health Organization, Fact sheet EURO/04/05, Berlin, Copenhagen, Rome. 2005; 4: 14.
6. Erxleben J, Elder K, Davis R. Comparison of spatial interpolation methods for estimating snow distribution in the Colorado Rocky Mountains. Hydrol Process. 2002; 16(18): 3627-49.
7. Miri M, Jamshidi S, Derakhshan Z, et al.
Spatial Analysis and Source Identification of Particulate Matter (PM10) in Yazd City. Journal of Community Health Research. 2016; 5(1): 45-56.
8. Miri M, Ghaneian MT, Gholizadeh A, et al. Assessment of Spatial Analysis Methods in Mapping of Air Pollution in Mashhad. J Environ Health Eng. 2016; 3(2): 143-54.
9. Alireza Norpoor FM. Determination of locality and time change in concentration of SO2 , NO2 and particle matter by GIS techniques in Tehran city. Environment Logy. 2014; 40(3): 723-38.
10. Eslami A, Atafar Z, Pirsaheb M, et al. Trends of particulate matter (PM10) concentration and related Air Quality Index (AQI) during 2005-2012 in Kermanshah, Iran. Journal of Health in the Field. 2017; 2(1): 8-16.
11. Xu C-y, Gong L, Jiang T, et al. Analysis of spatial distribution and temporal trend of reference evapotranspiration and pan evaporation in Changjiang (Yangtze River) catchment. J Hydrol (Amst). 2006; 327(1): 81-93.
12. Mehrjardi RT, Jahromi MZ, Mahmodi S, et al. Spatial distribution of groundwater quality with geostatistics (case study: Yazd-Ardakan Plain). World Appl Sci J. 2008; 4(1): 9-17.
13. Hengl T, Heuvelink GB, Stein A. A generic
framework for spatial prediction of soil variables based on regression-kriging. Geoderma. 2004; 120(1): 75-93.
14. Moran PA. Notes on continuous stochastic phenomena. Biometrika. 1950; 37(1-2): 17-23.
15. Organization WHO, UNAIDS. Air quality guidelines: global update 2005: World Health Organization; 2006.
16. Hoseinzadeh E, Samarghandi MR, Ghorbani Shahna F, et al. Isoconcentration mapping of particulate matter in Hamedan intercity bus stations. Water Environ J. 2013; 27(3): 418-24.
17. Sahsavani A, Yarahmadi M, Mesdaghinia A, et al. Analysis of dust storms entering Iran with emphasis on Khuzestan Province. Hakim Research. 2012; 3: 192-202.
18. Naddafi K, Ehrampoush M, Jafari V, et al. Investigation of total suspended particles and
its ingredients in the central part of Yazd. Journal of Shahid Sadoughi University of Medical Sciences and Health Services. 2008; 16(4): 21-5.
19. Jamshidi A, Karimzadeh Shirazi K, Raygan Shirazi A. Particulate Air Pollution Concentration in the City of Gachsaran, 2005-2006. Armaghane Danesh. 2007; 12(2): 89-97.
20. Lotfi MH, Nodoshan VJ. Examining Changes Trend of Fluoride Concentration in Groundwater Using Geo-Statistical Technique Case Study: Drinking Water wells in Yazd-Ardakan Plain. Journal of Community Health Research. 2015;4(3): 220-33.
21. Almodaresi SA, Jafari SJ, Hosseinzadeh E, et al. Investigation of Fluoride Concentration in Rural Drinking Water Resources of Bardaskan County Using Geographic Information System (GIS) in 2014. Journal of Torbat Heydariyeh University of Medical Sciences. 2016; 3(4): 32-41.
22. Shili ZLW. Spatial interpolation methods of daily weather data in northeast China. Quarterly Journal of Applied Meteorology. 2003; 5:1-10.
23. Berman JD, Breysse PN, White RH, et al. Evaluating methods for spatial mapping: Applications for estimating ozone concentrations across the contiguous United States. Environmental Technology & Innovation. 2015; 3: 1-10.
Full-Text: (1232 Views)
A Comparison on Function of Kriging and Inverse Distance Weighting Models in PM10 Zoning in Urban Area
Mohammad Hassan Ehrampoush 1, Sara Jamshidi 1, Mohammad Javad Zare Sakhvidi 2, Mohammad Miri 1*
Mohammad Hassan Ehrampoush 1, Sara Jamshidi 1, Mohammad Javad Zare Sakhvidi 2, Mohammad Miri 1*
- Environmental Science and Technology Research Center, Department of Environmental Health Engineering, School of Public Health, Shahid Sadoughi University of Medical Sciences, Yazd, Iran.
- Occupational Health Research Center, Department of Occupational Health, School of Public Health, Shahid Sadoughi University of Medical Sciences, Yazd, Iran.
| A R T I C L E I N F O | ABSTRACT | |
| ORIGINAL ARTICLE | Introduction: The present study aimed to compare the performance of two widely-used models for spatial assessment of particulate matter less than 10 microns (PM10) in ambient air of Yazd city. Finally, effective factors on concentrations of pollutants and corresponding standards were investigated. Materials and Methods: A number of 13 sampling stations were employed in different areas of Yazd to sample PM10 within two seasons of winter and spring of 2012 and 2013. PM10 was measured by HAZ-DUST EPAM-5000 particulate air monitor. In order to assess the efficiency of Kriging and Inverse Distance Weighting (IDW) models for PM10 zoning, the statistical Root Mean Square Error (RMSE) and %RMSE methods were used in the Arc GIS software version 10.1. Results: The highest (297 µg/m3) and lowest concentrations (35.8 µg/m3) of PM10 in spring were found in high-traffic historical regions and low-traffic suburban areas, respectively. High-traffic and historical regions had higher levels of PM10 compared to other regions. Given the values of RMSE and %RMSE indicators, Kriging interpolation method was better for zoning of the pollutant PM10 in both winter and spring. Conclusion: According to higher concentration of PM10 compared to WHO standard values particularly in spring, necessary actions and solutions should be taken for the pollution reduction. This study indicated that Kriging model has a better efficiency for spatial analysis of suspended particles, compared to IDW method. |
|
| Article History: Received: 11 August 2017 Accepted: 20 November 2017 |
||
| *Corresponding Author: Mohammad Miri Email: M_miri87@yahoo.com Tel: +98 912 935 7588 |
||
| Keywords: Suspended Particles, Interpolation, Kriging Model, Geographic Information, Yazd City. |
Citation: Ehrampoush MH, Jamshidi S, Zare Sakhvidi MJ, et al. A Comparison on Function of Kriging and Inverse Distance Weighting Models in PM10 Zoning in Urban Area. J Environ Health Sustain Dev. 2017; 2(4): 379-87.
Introduction
Today, with expansion of cities and increase of population, annual mortality of thousands of people has been proved to be due to intensified acute effects of air pollution on human health. Excessive traffic and industrial development can be pointed as the major causes of such pollutions, which result in increased consumption of fossil fuels and ascending polluted air. Although the air pollutants with very low concentrations with values lower than the standard must cause no harmful effect on human health, it may be detrimental for sensitive populations 1. However, the pollution resulting from fuel combustion has been decreased significantly in developed countries within the recent years. The most hygienic concerns for the cities' air tend to new-born pollutants such as Ozone and NO2 and changed distribution and size of air suspended particles. A part of these particles is generated by imperfect combustion of fossil fuels, which pollutes the soils after being expressed in atmosphere by atmospheric precipitations. Besides, environmental pollutions are generated in the soil by industrial activities including petrochemical, petroleum, and similar industries 2. The epidemiological studies within two recent decades suggest that urban air pollution results in respiratory problems, cardiovascular diseases, chronic bronchitis, and even death 3. The studies show that biological mechanisms of the pollutants effective on human health are not clearly identified and they are likely to be resulted from oxidation potential of pollutants from two ways including direct impacts on cellular components of airways and through oxidation of activated intracellular routes 4. WHO reports indicate that the particles smaller than 10 microns and SO2 can lead to respiratory and cardiovascular diseases such as asthma, bronchial, heart attacks, lung function conflict, and even mortality. This is so that the mortality rate increases 6% in some European cities for every increase of 10 micrograms per cubic meter 5. Diverse methods exist for air pollution estimation. One of these methods is integration of pollution measurement stations' information and spatial analysis approaches 6. Kriging model is a conventional method in spatial analysis. This interpolation method that is based on regression conducts weight assignment not only between the surrounding points but also based on the correlation between measurement points 7, 8. The study carried out by Akbari et al., 9 on air quality of Mashhad used IDW zoning method and was based on Pollutant Standards Index (PSI). It was reported that the air quality in spring of 2009 was very unhealthy and dangerous, while all seasons had undesirable air conditions. In this study, suspended particles and Carbon monoxide (CO) were used for PSI determination. In another study conducted in Kermanshah, concentration of PM10 pollutants was reported higher than other cases 10. The present study aimed to assess diverse effective factors on concentration of suspended particles (i.e., Traffic, wind direction, urban structure, etc.) and to conduct spatial analysis of PM10 in Yazd air through two models of Kriging interpolation and IDW in a comparative manner. Ultimately, concentrations of these pollutants were compared to the standard scores.
Materials and Methods
Studied region
Yazd is the most populous city of Yazd Province and is political-administrative center of this province located in longitude of 54 and latitude of 31. It has a population of about 560,000 people among whom 500,000 live in urban and 60,000 people reside in rural areas. The climate in this city is hot and dry in desert conditions with an annual precipitation of about 50 ml. Figure 1 shows the studied region and sampling points.
Today, with expansion of cities and increase of population, annual mortality of thousands of people has been proved to be due to intensified acute effects of air pollution on human health. Excessive traffic and industrial development can be pointed as the major causes of such pollutions, which result in increased consumption of fossil fuels and ascending polluted air. Although the air pollutants with very low concentrations with values lower than the standard must cause no harmful effect on human health, it may be detrimental for sensitive populations 1. However, the pollution resulting from fuel combustion has been decreased significantly in developed countries within the recent years. The most hygienic concerns for the cities' air tend to new-born pollutants such as Ozone and NO2 and changed distribution and size of air suspended particles. A part of these particles is generated by imperfect combustion of fossil fuels, which pollutes the soils after being expressed in atmosphere by atmospheric precipitations. Besides, environmental pollutions are generated in the soil by industrial activities including petrochemical, petroleum, and similar industries 2. The epidemiological studies within two recent decades suggest that urban air pollution results in respiratory problems, cardiovascular diseases, chronic bronchitis, and even death 3. The studies show that biological mechanisms of the pollutants effective on human health are not clearly identified and they are likely to be resulted from oxidation potential of pollutants from two ways including direct impacts on cellular components of airways and through oxidation of activated intracellular routes 4. WHO reports indicate that the particles smaller than 10 microns and SO2 can lead to respiratory and cardiovascular diseases such as asthma, bronchial, heart attacks, lung function conflict, and even mortality. This is so that the mortality rate increases 6% in some European cities for every increase of 10 micrograms per cubic meter 5. Diverse methods exist for air pollution estimation. One of these methods is integration of pollution measurement stations' information and spatial analysis approaches 6. Kriging model is a conventional method in spatial analysis. This interpolation method that is based on regression conducts weight assignment not only between the surrounding points but also based on the correlation between measurement points 7, 8. The study carried out by Akbari et al., 9 on air quality of Mashhad used IDW zoning method and was based on Pollutant Standards Index (PSI). It was reported that the air quality in spring of 2009 was very unhealthy and dangerous, while all seasons had undesirable air conditions. In this study, suspended particles and Carbon monoxide (CO) were used for PSI determination. In another study conducted in Kermanshah, concentration of PM10 pollutants was reported higher than other cases 10. The present study aimed to assess diverse effective factors on concentration of suspended particles (i.e., Traffic, wind direction, urban structure, etc.) and to conduct spatial analysis of PM10 in Yazd air through two models of Kriging interpolation and IDW in a comparative manner. Ultimately, concentrations of these pollutants were compared to the standard scores.
Materials and Methods
Studied region
Yazd is the most populous city of Yazd Province and is political-administrative center of this province located in longitude of 54
Figure 1: The studied region and sampling points
Data collection
In the present study, PM10 particles were measured by HAZ-DUST EPAM-5000 particulate air monitor. This device responds quickly and logs the data associated with the particles harmful to the respiratory system. To separate unique particles for particles measurement by 47 mm-sized filters for weight studies according to Environmental Protection Agency (EPA) and Tapered Element Oscillating Micro Balance (TEOM) measurement methods. The advantages of this machine include measurement of particles, weights and their indication simultaneously, direct display of measured data and data transfer, graphical profile of measured data, and set up in less than 15 seconds. The sampled air is passed initially through an optical sensor and then through a 7mm-sized filter embedded just after the optical sensor and is designed based on the EPA standards. The device is easy to use, can be set up quickly, and can be applied for measurements of TSP, PM10, PM2.5, and PM1. A total number of 13 sampling stations were selected and the sampling was carried out in fresh air according to EPA standard in a distance of 20m from street and other resources of pollution at a height of 15m above the ground. The sampling locations were selected based on proximity to the industrial area, low-traffic areas, areas with continuous traffic, high-traffic area, and suburbs. The sampling was conducted randomly in winter and spring of 2012 and 2013 a week per month and finally seasonal average was calculated for modeling and spatial analysis of the pollutant PM10.
Spatial analysis methods
The software package Arc GIS Version 10.1 (developed by the company ESRI) was used for spatial analysis of the data associated with the concentration of PM10 in Yazd air. Moran’s Index self-correlation analysis was used for evaluation of the data associated with suspended particles' concentration in space. The aim was to determine if they have random distribution, to show correlation between the points, and to reveal spatial variability of the studied phenomena (Air quality of Yazd).
IDW method
IDW method considers a weight based on the distance between that point and position of unknown point. Then, these weights are controlled according to weighting power in such a way that the greater powers decrease the distance of further points from estimated point and the smaller powers distribute weights more evenly between neighbor points. However, this method only considers the distance between the points, disregarding position and arrangement of the points. In other words, the points with the same distance from the estimation point have the same weight. The weight factor can be derived using the following equation:
 Equation (1)
Where, is the weight of ith station, Di is the distance from the station i to unknown point, and α is the weighting power.
Kriging method
This method relies on weighted moving average and is the best unbiased estimator that specifies not only the estimated values, but also the estimation error at each point. In the last decade, Kriging has been widely used as a powerful interpolation method in diverse areas of geosciences such as hydrology, soil science, and mine. Despite all advantages of this method, normalization of the changes while estimation causes the estimated samples' variance to have lower changes compared to the real points, in other words, changes in the model prediction are lower than the reality 11. In total, success of this method in interpolation of variables quite depends on the precision to select data model with experimental semi-variogram. If the model selection is performed with sufficient precision, the interpolation result will be suitable. In some cases, the results of this method are not sufficiently precise, which is due to some reasons including inconsistency between spatial structure and general structure, low-precision data, and heterogeneity of spatial data.
In the present study, the ordinal Kriging methods were used to assess spatial and temporal changes in concentration of PM10 in Yazd. Kriging method is an approach that uses spatial correlation structure of phenomena in spatial evaluation. In ordinal Kriging method, a certain range of points can be considered in interpolation for each destination point. It is noteworthy to mention that the sampled points’ coordinations are based on Universal Transverse Mercator (UTM). The corresponding equation can be found as follows:
 Equation (2)
Where, Z*(xi) is the estimation criterion, is weight/importance of the quantity dependent on ith sample, and z (xi) is the measured variable.
Accuracy of the used model and variogram
The model validation was conducted using following evaluation criteria 12:
 Equation (3)
 Equation (4)
Where, n is the number of data, qi is the measured value, and qˆi is the predicted value by the mod el. µ
is the average of each measurement component. The value of Root Mean Square Error (RMSE) is null in optimal mode or the mode where estimated and measured values are equal. With lower values of RMSE, the accuracy for prediction of the interpolation method is higher. RMSE is sensitive to outlier data and for this reason %RMSE can be used. The lower value of this feature indicates higher precision of estimation or low difference between real values and estimated ones. The acceptable limit of %RMSE is 40 and those higher than 70% indicate imprecision of estimate points and plenty of changes between the measured values and estimated ones 13.
Results
Statistical summary of the sampling stations in Yazd is presented in figure1. Based on the data given in this figure, seasonal average of the pollutant PM10 in spring (155 µg/m3) is higher than that of spring (87.27 µg/m3). The highest concentration of the pollutant is related to spring and the Mahdi station (297 µg/m3), while the lowest one pertains to the spring and the Navab Blvd station (8.5 µg/m3).
In the present study, PM10 particles were measured by HAZ-DUST EPAM-5000 particulate air monitor. This device responds quickly and logs the data associated with the particles harmful to the respiratory system. To separate unique particles for particles measurement by 47 mm-sized filters for weight studies according to Environmental Protection Agency (EPA) and Tapered Element Oscillating Micro Balance (TEOM) measurement methods. The advantages of this machine include measurement of particles, weights and their indication simultaneously, direct display of measured data and data transfer, graphical profile of measured data, and set up in less than 15 seconds. The sampled air is passed initially through an optical sensor and then through a 7mm-sized filter embedded just after the optical sensor and is designed based on the EPA standards. The device is easy to use, can be set up quickly, and can be applied for measurements of TSP, PM10, PM2.5, and PM1. A total number of 13 sampling stations were selected and the sampling was carried out in fresh air according to EPA standard in a distance of 20m from street and other resources of pollution at a height of 15m above the ground. The sampling locations were selected based on proximity to the industrial area, low-traffic areas, areas with continuous traffic, high-traffic area, and suburbs. The sampling was conducted randomly in winter and spring of 2012 and 2013 a week per month and finally seasonal average was calculated for modeling and spatial analysis of the pollutant PM10.
Spatial analysis methods
The software package Arc GIS Version 10.1 (developed by the company ESRI) was used for spatial analysis of the data associated with the concentration of PM10 in Yazd air. Moran’s Index self-correlation analysis was used for evaluation of the data associated with suspended particles' concentration in space. The aim was to determine if they have random distribution, to show correlation between the points, and to reveal spatial variability of the studied phenomena (Air quality of Yazd).
IDW method
IDW method considers a weight based on the distance between that point and position of unknown point. Then, these weights are controlled according to weighting power in such a way that the greater powers decrease the distance of further points from estimated point and the smaller powers distribute weights more evenly between neighbor points. However, this method only considers the distance between the points, disregarding position and arrangement of the points. In other words, the points with the same distance from the estimation point have the same weight. The weight factor can be derived using the following equation:
Equation (1)Where,
Kriging method
This method relies on weighted moving average and is the best unbiased estimator that specifies not only the estimated values, but also the estimation error at each point. In the last decade, Kriging has been widely used as a powerful interpolation method in diverse areas of geosciences such as hydrology, soil science, and mine. Despite all advantages of this method, normalization of the changes while estimation causes the estimated samples' variance to have lower changes compared to the real points, in other words, changes in the model prediction are lower than the reality 11. In total, success of this method in interpolation of variables quite depends on the precision to select data model with experimental semi-variogram. If the model selection is performed with sufficient precision, the interpolation result will be suitable. In some cases, the results of this method are not sufficiently precise, which is due to some reasons including inconsistency between spatial structure and general structure, low-precision data, and heterogeneity of spatial data.
In the present study, the ordinal Kriging methods were used to assess spatial and temporal changes in concentration of PM10 in Yazd. Kriging method is an approach that uses spatial correlation structure of phenomena in spatial evaluation. In ordinal Kriging method, a certain range of points can be considered in interpolation for each destination point. It is noteworthy to mention that the sampled points’ coordinations are based on Universal Transverse Mercator (UTM). The corresponding equation can be found as follows:
Equation (2)Where, Z*(xi) is the estimation criterion,
Accuracy of the used model and variogram
The model validation was conducted using following evaluation criteria 12:
Equation (3)Equation (4)Where, n is the number of data, qi is the measured value, and qˆi is the predicted value by the mod el. µ
is the average of each measurement component. The value of Root Mean Square Error (RMSE) is null in optimal mode or the mode where estimated and measured values are equal. With lower values of RMSE, the accuracy for prediction of the interpolation method is higher. RMSE is sensitive to outlier data and for this reason %RMSE can be used. The lower value of this feature indicates higher precision of estimation or low difference between real values and estimated ones. The acceptable limit of %RMSE is 40 and those higher than 70% indicate imprecision of estimate points and plenty of changes between the measured values and estimated ones 13.
Results
Statistical summary of the sampling stations in Yazd is presented in figure1. Based on the data given in this figure, seasonal average of the pollutant PM10 in spring (155 µg/m3) is higher than that of spring (87.27 µg/m3). The highest concentration of the pollutant is related to spring and the Mahdi station (297 µg/m3), while the lowest one pertains to the spring and the Navab Blvd station (8.5 µg/m3).
|
Figure 2: The statistical summary associated with the sampling stations for PM10 in Yazd air
In this study, Moran’s autocorrelation analysis was implemented. This factor shows that spatial pattern of data is clustered, dispersed, or random (Table 1). If the indicator is in the range of -1.65 to 1.65, the distribution will be random, if it is lower than -1.65 it will be dispersed, and in case of values higher than 1.65 it will be clustered 14. According to the data of spatial correlation associated with suspended particles, PM10 has a random distribution in both spring and winter. This can indicate that diffusion source of the suspended particles PM10 is not fixed and diverse factors are effective on its concentration. The mobile diffusion sources (e.g., vehicles) are likely to be the most effective factors in random distribution of pollutants.
Table 1: Moran’s autocorrelation for the pollutant PM10 in winter and spring
| Moran's Index | z-score | Distribution | |
| Winter 2012 | 0.0391 | 0.8685 | Random |
| Spring 2013 | 0.0143 | 1.608 | Random |
For spatial analysis of data by Kriging interpolation method, diverse semivariograms, logarithmic, and Box-Cox methods were initially used for data normalization. Ultimately, based on the lowest value of RMSE for the data associated with winter, the whole effect semivariogram was used. However, the K-Bessel semivariogram was applied along with Box-Cox normalization method for spring. The powers 1, 2, and 3 were used for IDW method to select optimal conditions and ultimately, according to RMSE value, the power 1 was used for zoning. Figures 3A, 3B, 4A, and 4B show zoning map of the PM10 regarding winter and spring into two models of Kriging and IDW, respectively. In winter, the western and south-western portions of the city had the highest concentration of suspended particles. This may be due to the existence of a ring road along the north-western to south-western parts of the city and industrial zones. In addition to western and south-western parts of the city, the eastern part had very high concentration of the pollutant PM10 in spring. Since the north eastern part (surrounding the sampling stations 5, 6 and 9) is located in historic texture of the city, it is polluted while high traffic of Imam Khomeini street (Station 6) has increased this pollution.
Figure 3A: PM10 Suspended particles zoning by Kriging method in winter
Figure 3B: PM10 Suspended particles zoning by IDW method in winter
Figure 4A: PM10 Suspended particles zoning by Kriging method in spring
Figure 4B: PM10 Suspended particles zoning by IDW method in spring
In order to assess efficiency of Kriging and IDW methods in zoning of the pollutant PM10 in Yazd, RMSE and %RMSE indicators were used. RMSE values for Kriging and IDW models were respectively 45.493 and 66.188 for winter and 56.525 and 61.47 for spring. The lower value of RMSE in winter is due to lower average of sampling stations data and lack of outliers. In both winter and spring, the value of RMSE in Kriging model was lower than that of IDW, indicating better fitness of this model. The %RMSE in Kriging model was 52% and 36% for winter and spring, respectively. This represents reasonable efficiency of Kriging model for suspended particles zoning in winter and suitable efficiency for the data associated with the spring. Table 2 shows detailed statistics for comparison of Kriging and IDW models in zoning suspended particles in Yazd.
Table 2: Statistical summary for zoning PM10 suspended particles by Kriging and IDW models
| Model | RMSE | RMSE(%) | Functioning | |
| Winter | Kriging | 45.493 | 52% | Acceptable |
| IDW | 66.188 | 75% | Unacceptable | |
| Spring | Kriging | 56.525 | 36% | Acceptable |
| IDW | 61.470 | 39% | Acceptable |
Discussion
Spatial analysis and assessment of concentration changes on the pollutant PM10 were conducted in this study in winter and spring of 2012 and 2013. The sampling was carried out in diverse parts of the city and finally zoning was performed using IDW and Kriging interpolation methods. The mean concentration of PM10 pollutant in spring was higher than winter. Accordingly, higher pollutant concentrations were observed in high-traffic, historical regions of the city, as well as areas near the ring road. Concentration of PM10 was higher than the WHO standard (20 µg/m3) in 11 of 13 measurement stations in winter 15. Likewise in spring, seasonal concentration mean at all stations was higher than that of WHO standard. Station 9 showed a concentration that was 14.8 times higher than the WHO standard in spring. In a study conducted by Hosseinzadeh et al., in Hamedan the total average values of the suspended particles of TSO, PM10, and PM2.5 were 16, 7.72, and 4.7 times higher than the standard air quality stated in WHO regulations. The suspended particles were found to have no significant correlation with wind speed and temperature 16. Shahsavani et al., studied the dust that entered to Khouzestan province and found that in dusty days, the particles' concentration in Ahwaz increased up to 16.5 times higher than the standard value 17. In the study carried out by Nadafi et al. on Yazd air, suspended particles in spring were found to be higher than other seasons that is in line with findings of the present work 18. Moreover, Jamshidi et al., reported the highest rate of suspended particles for May and July 19.
In this study, according to RMSE percentage, Kriging model showed a desired efficiency in PM10 suspended particles zoning in Yazd air and generally showed better results in both winter and spring in zoning PM10 suspended particles. Several studies indicated that Kriging model provides a better efficiency in air pollution zoning compared to other interpolation methods 20- 23. In the study conducted by Nourpour et al. in Tehran spatial and temporal changes of pollutants such as sulfur dioxide, nitrogen dioxide, and suspended particles were determined using GIS techniques. The ability of ordinal Kriging model in using spherical semivariogram with RMSE was proved to be 17.47 times higher than other methods 9. Moreover, in the study carried out by Berman et al. , 23 to evaluate diverse models of spatial analysis for zoning concentration of ozone in the US, the rates of R2 and RMSE for IDW and Kriging models were 0.74, 8.163, 0.79, and 6.983, respectively.This indicates higher efficiency of Kriging model to zone air pollutants compared to IDW.
Conclusion
The current study showed that traffic and spatial factors are highly effective on the rate of suspended particles in air. The areas in neighborhood of main and high-traffic streets as well as historical areas with adobe structures can influence concentrations of the suspended particles. In addition, concentrations of suspended particles in winter and spring were higher than those of WHO standards. Therefore, necessary actions should be taken to prevent from harmful effects of this pollutant on residents of Yazd. Such actions are Development of public transportation, replacement of old vehicles, expansion of green space, reconstruction of the historical context of the city so that it does not produce dust, and recommendation of necessary health advices in high-polluted days. Finally, compared to IDW model, the interpolation Kriging model was proved to have higher ability in spatial analysis of suspended particles, so, it can be used in future studies.
Acknowledgements
This article was composed based on the reported data in senior thesis of Ms. Sarah Jamshidi. The authors thank everyone who contributed in this
study.
Funding
This study was funded by School of Public Health, Shahid Sadoghi University of Medical Sciences.
Conflict of interest
The authors declare that there is no conflict of interest.
This is an Open Access article distributed in accordance with the terms of the Creative Commons Attribution (CC BY 4.0) license, which permits others to distribute, remix, adapt and build upon this work, for commercial use.
References
1. De Meij A, Thunis P, Bessagnet B, et al. The sensitivity of the CHIMERE model to emissions reduction scenarios on air quality in Northern Italy. Atmos Environ. 2009; 43(11): 1897-907.
2. Downs SH, Schindler C, Liu L-JS, et al. Reduced exposure to PM10 and attenuated age-related decline in lung function. New England Journal of Medicine. 2007; 357(23): 2338-47.
3. Fattore E, Paiano V, Borgini A, et al. Human health risk in relation to air quality in two municipalities in an industrialized area of Northern Italy. Environmental research. 2011; 111(8):
1321-7.
4. Glinianaia SV, Rankin J, Bell R, et al. Particulate air pollution and fetal health: a systematic review of the epidemiologic evidence. Epidemiology. 2004; 15(1): 36-45.
5. Krzyzanowski M, Bundeshaus G, Negru ML, et al. Particulate matter air pollution: how it
harms health. World Health Organization, Fact sheet EURO/04/05, Berlin, Copenhagen, Rome. 2005; 4: 14.
6. Erxleben J, Elder K, Davis R. Comparison of spatial interpolation methods for estimating snow distribution in the Colorado Rocky Mountains. Hydrol Process. 2002; 16(18): 3627-49.
7. Miri M, Jamshidi S, Derakhshan Z, et al.
Spatial Analysis and Source Identification of Particulate Matter (PM10) in Yazd City. Journal of Community Health Research. 2016; 5(1): 45-56.
8. Miri M, Ghaneian MT, Gholizadeh A, et al. Assessment of Spatial Analysis Methods in Mapping of Air Pollution in Mashhad. J Environ Health Eng. 2016; 3(2): 143-54.
9. Alireza Norpoor FM. Determination of locality and time change in concentration of SO2 , NO2 and particle matter by GIS techniques in Tehran city. Environment Logy. 2014; 40(3): 723-38.
10. Eslami A, Atafar Z, Pirsaheb M, et al. Trends of particulate matter (PM10) concentration and related Air Quality Index (AQI) during 2005-2012 in Kermanshah, Iran. Journal of Health in the Field. 2017; 2(1): 8-16.
11. Xu C-y, Gong L, Jiang T, et al. Analysis of spatial distribution and temporal trend of reference evapotranspiration and pan evaporation in Changjiang (Yangtze River) catchment. J Hydrol (Amst). 2006; 327(1): 81-93.
12. Mehrjardi RT, Jahromi MZ, Mahmodi S, et al. Spatial distribution of groundwater quality with geostatistics (case study: Yazd-Ardakan Plain). World Appl Sci J. 2008; 4(1): 9-17.
13. Hengl T, Heuvelink GB, Stein A. A generic
framework for spatial prediction of soil variables based on regression-kriging. Geoderma. 2004; 120(1): 75-93.
14. Moran PA. Notes on continuous stochastic phenomena. Biometrika. 1950; 37(1-2): 17-23.
15. Organization WHO, UNAIDS. Air quality guidelines: global update 2005: World Health Organization; 2006.
16. Hoseinzadeh E, Samarghandi MR, Ghorbani Shahna F, et al. Isoconcentration mapping of particulate matter in Hamedan intercity bus stations. Water Environ J. 2013; 27(3): 418-24.
17. Sahsavani A, Yarahmadi M, Mesdaghinia A, et al. Analysis of dust storms entering Iran with emphasis on Khuzestan Province. Hakim Research. 2012; 3: 192-202.
18. Naddafi K, Ehrampoush M, Jafari V, et al. Investigation of total suspended particles and
its ingredients in the central part of Yazd. Journal of Shahid Sadoughi University of Medical Sciences and Health Services. 2008; 16(4): 21-5.
19. Jamshidi A, Karimzadeh Shirazi K, Raygan Shirazi A. Particulate Air Pollution Concentration in the City of Gachsaran, 2005-2006. Armaghane Danesh. 2007; 12(2): 89-97.
20. Lotfi MH, Nodoshan VJ. Examining Changes Trend of Fluoride Concentration in Groundwater Using Geo-Statistical Technique Case Study: Drinking Water wells in Yazd-Ardakan Plain. Journal of Community Health Research. 2015;4(3): 220-33.
21. Almodaresi SA, Jafari SJ, Hosseinzadeh E, et al. Investigation of Fluoride Concentration in Rural Drinking Water Resources of Bardaskan County Using Geographic Information System (GIS) in 2014. Journal of Torbat Heydariyeh University of Medical Sciences. 2016; 3(4): 32-41.
22. Shili ZLW. Spatial interpolation methods of daily weather data in northeast China. Quarterly Journal of Applied Meteorology. 2003; 5:1-10.
23. Berman JD, Breysse PN, White RH, et al. Evaluating methods for spatial mapping: Applications for estimating ozone concentrations across the contiguous United States. Environmental Technology & Innovation. 2015; 3: 1-10.
Type of Study: Original articles |
Subject:
Special
Received: 2017/08/11 | Accepted: 2017/11/20 | Published: 2017/12/19
Received: 2017/08/11 | Accepted: 2017/11/20 | Published: 2017/12/19
| Rights and permissions | |
 |
This work is licensed under a Creative Commons Attribution-NonCommercial 4.0 International License. |
