

Volume 10, Issue 2 (June 2025)
J Environ Health Sustain Dev 2025, 10(2): 2666-2693 |
Back to browse issues page


Download citation:
BibTeX | RIS | EndNote | Medlars | ProCite | Reference Manager | RefWorks
Send citation to:


BibTeX | RIS | EndNote | Medlars | ProCite | Reference Manager | RefWorks
Send citation to:
Silwani T, Themba N, Chokwe T B, Semenya K. Assessment of Groundwater Quality, Heavy Metal Contamination, and Human Health Risks in Roundhill Municipal Landfill, Eastern Cape, South Africa. J Environ Health Sustain Dev 2025; 10 (2) :2666-2693
URL: http://jehsd.ssu.ac.ir/article-1-887-en.html
URL: http://jehsd.ssu.ac.ir/article-1-887-en.html


University of South Africa, Department of Environmental Sciences, Florida science campus, Cnr Christian de Wet Road and Pioneer Avenue, Florida 1709, South Africa
Keywords: Groundwater, Water Pollution, Landfills, Metals, Heavy, Escherichia coli, Water Quality, Risk Assessment.
Full-Text [PDF 1078 kb]
(869 Downloads)
| Abstract (HTML) (1512 Views)
.JPG)
Figure 1: Aerial view of the Roundhill landfill site showing the locations of the boreholes.
Irrigation Water Quality Assessment
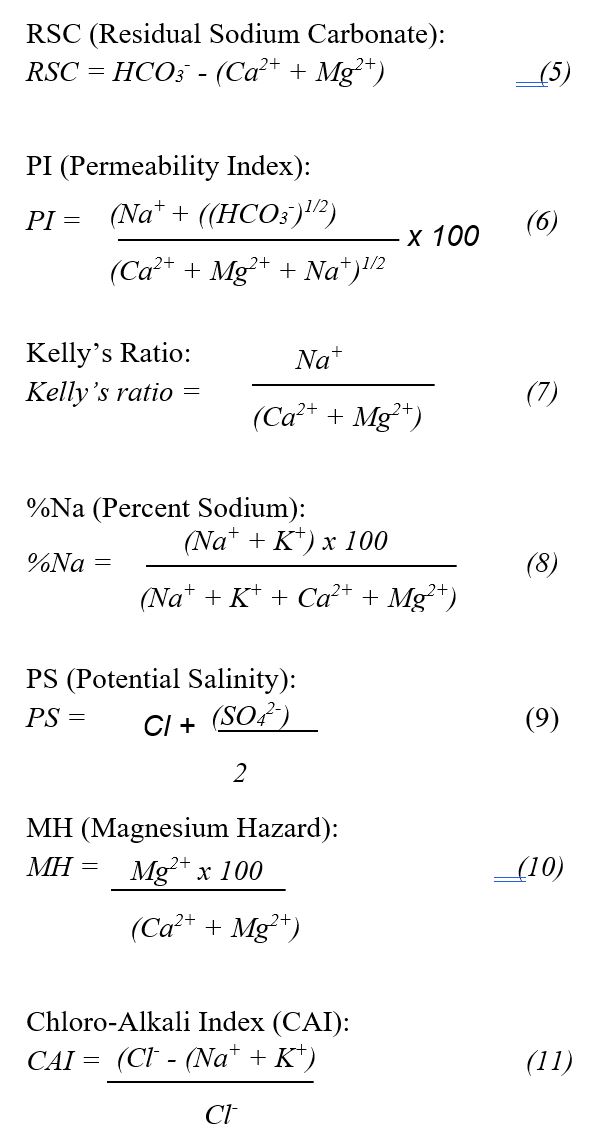
The suitability of groundwater for irrigation was evaluated through a detailed assessment of various physicochemical properties and chemical indices. These indices provide valuable insights into the potential impact of water quality on soil structure, crop yield, and overall agricultural sustainability. Established methodologies from previous studies 21, 22, 23 were employed to calculate critical indices, including the Sodium Adsorption Ratio (SAR), Residual Sodium Carbonate (RSC), Permeability Index (PI), Kelly’s Ratio, Percent Sodium (%Na), Potential Salinity (PS), Magnesium Hazard (MH), and Chloro-Alkali Index (CAI). The formulas used to compute these indices are outlined below to ensure a comprehensive evaluation of irrigation water quality and its implications for agricultural use.
Where:
An HQ greater than 1 indicates the potential for non-carcinogenic health effects.
Carcinogenic Risk:
The Lifetime Cancer Risk (LCR) is calculated as
LCR = ADDcarcinogenic × Cancer Slope Factor (LCR) (14)
An LCR between 10-6 and 10-4 is typically considered acceptable.
Reference Values:
Reference Doses (RfD) and Cancer Slope Factors (CSF): Obtained from the Integrated Risk Information System (IRIS) database of the EPA
Mugudamani et al.25 provided a comprehensive framework for assessing both non-carcinogenic and carcinogenic risks associated with trace element exposure. Their methodology emphasizes the importance of considering multiple exposure pathways and utilizing standardized toxicity values to evaluate potential health effects. Applying similar approaches ensures a thorough assessment of the health risks posed by contaminants in groundwater sources.
Statistical Analysis
A combination of statistical techniques was employed to evaluate the relationships among the water quality parameters in groundwater and landfill leachate. Due to the non-parametric distribution of much of the data and the presence of potential outliers, Spearman’s rank correlation coefficient was used to assess monotonic associations among contaminants, following the methodology of Mugudamani et al.25. This approach provides robust insights into the strength and direction of the relationships between variables, particularly in datasets that do not conform to normality. In parallel, Pearson’s correlation analysis was applied to the selected borehole samples to examine the inter-elemental relationships among the HMs. This analysis offers deeper insight into the degree of linear association between specific metals, supporting inferences about potential common sources, such as landfill leachate or industrial discharge. To further explore contamination patterns and identify the dominant pollution sources, PCA was conducted. PCA was used to reduce data dimensionality by grouping strongly correlated variables into principal components, thus aiding in the interpretation of pollution origins and their relative contributions to groundwater contamination. To validate the suitability of the dataset for PCA, both the Kaiser-Meyer-Olkin (KMO) measure and Bartlett’s test of sphericity were conducted. A KMO value of 0.625 and a significant Bartlett’s test (p < 0.01) confirmed the appropriateness of the data for the factor analysis. Collectively, these statistical methods provide critical insights into contaminant associations, source apportionment, and the likely influence of leachate infiltration on groundwater quality deterioration.
Results
This section presents a comprehensive analysis of groundwater and landfill leachate quality, focusing on three major categories of analytes: physicochemical parameters, heavy metals (HMs), and microbial contaminants. The data represent the mean values from triplicate measurements to ensure accuracy and reliability. Samples were collected from five boreholes (designated BH1 to BH5) situated around the landfill, along with samples taken directly from the landfill leachate. All results were benchmarked against the SANS 241 guidelines for drinking water quality, providing critical insights into the extent of groundwater contamination attributable to landfill leachate infiltration.
Groundwater and Landfill Leachate Characteristics
The pH of the groundwater samples across the five boreholes varied between 7.29 and 7.69, indicating a slightly alkaline nature, whereas the landfill leachate exhibited a somewhat higher pH value of 8.39. These pH values fall comfortably within the SANS 241 acceptable range of 5–9.7, suggesting that the acidity or alkalinity levels are unlikely to pose immediate health risks. In contrast, the color measurements demonstrated marked contamination in the boreholes proximal to the landfill site. Specifically, BH1 recorded the highest color intensity at 51 Pt-Co units, surpassing the SANS guideline limit of 15 Pt-Co, followed by BH2 with a value of 20 Pt-Co units. The remaining boreholes (BH3–BH5) showed color values between 15 and 19 Pt-Co, with BH5 resting on the upper permissible threshold. Notably, the landfill leachate sample exhibited an extremely elevated color value of 801 Pt-Co units, reflecting a high concentration of dissolved organic matter and other colored substances typical of leachate contamination. Turbidity measurements paralleled the color results, with BH1 and BH2 registering significantly elevated turbidity values of 373 NTU and 42.4 NTU, respectively, both well above the recommended limit of 5 NTU. Boreholes BH3 and BH4 showed moderate turbidity levels of 33 NTU and 8.6 NTU, respectively, whereas BH5 remained within acceptable limits at 1.66 NTU. The turbidity of the landfill leachate was also elevated at 106 NTU, indicating a high load of suspended solids and colloidal particles.
TDS concentrations displayed substantial variation between groundwater and leachate samples. The leachate had an exceptionally high TDS concentration of 89,900 mg/L, indicative of intense mineral dissolution and the presence of ions typical of landfill leachate. Conversely, the boreholes exhibited considerably lower TDS values: 516 mg/L in BH1, 790 mg/L in BH2, 278 mg/L in BH3, 239 mg/L in BH4, and 768 mg/L in BH5. The conductivity measurements closely mirrored the TDS results, with the leachate showing a very high conductivity of 1,661 mS/m, while the boreholes ranged from 49.6 mS/m in BH4 to 166 mS/m in BH5. Nitrate concentrations were also highly variable in this study. The landfill leachate contained a nitrate concentration of 160 mg/L, far exceeding the SANS 241 limit of 11 mg/L, highlighting a significant source of nitrogen pollution in the area. Among the boreholes, BH1 recorded the highest nitrate level at 24.8 mg/L, exceeding the guideline, whereas the other boreholes presented much lower nitrate concentrations between 2.15 and 2.8 mg/L. Nitrite (NO₂⁻) was generally below the detectable limit in all boreholes, except for BH5, which exhibited a NO₂⁻ concentration of 2.1 mg/L, surpassing the permissible limit of 0.9 mg/L. The landfill leachate NO₂⁻ levels remained below the detection threshold.
Ammonia concentrations were particularly elevated in BH1 and BH2, measuring 24.8 mg/L and 31 mg/L, respectively, both of which significantly exceeded the SANS 241 guideline value of 1.5 mg/L. The landfill leachate showed a notably high ammonia concentration of 180 mg/L, consistent with the presence of decomposed organic matter and nitrogenous wastes. Other boreholes contained ammonia levels lower than these values but were still above typical background concentrations. Overall, the comparative analysis revealed that landfill leachate exhibited markedly elevated concentrations across all measured physicochemical parameters compared to groundwater samples. The boreholes closest to the landfill (BH1 and BH2) tended to show higher contamination levels, suggesting leachate intrusion and an impact on groundwater quality. These findings underscore the significant influence of landfill activities on groundwater deterioration, as detailed in Table 4, and highlight the necessity for ongoing monitoring and mitigation efforts to protect drinking water sources in the surrounding communities.
.JPG)
Figure 2: Spearman correlation heatmap of groundwater quality parameters across boreholes BH1–BH5 near the Roundhill Landfill Site.
.JPG)
Figure 3: PCA biplot of groundwater quality parameters across boreholes BH1–BH5 near the Roundhill Landfill Site.
Table 8: Non-carcinogenic risk assessment (HQ values) for borehole water contaminants
Table 9: Carcinogenic risk assessment (LCR values) for borehole water contaminants
Full-Text: (1435 Views)
Assessment of Groundwater Quality, Heavy Metal Contamination, and Human Health Risks in Roundhill Municipal Landfill, Eastern Cape, South Africa
Timoti Silwani 1, Nomathemba Themba 1*, Tlou Bernad Chokwe 1,2, Khomotso Semenya 1
1 University of South Africa, Department of Environmental Sciences, Florida science campus, Cnr Christian de Wet Road and Pioneer Avenue, Florida 1709, South Africa.
2 Infrastructure Department, Scientific Services Unit, Capricorn District Municipality, 24 Thabo Mbeki Street, Polokwane 0699, South Africa.
| A R T I C L E I N F O | ABSTRACT | |
| ORIGINAL ARTICLE | Introduction: This study evaluates the impact of the Roundhill municipal landfill on groundwater quality in Berlin, Eastern Cape, South Africa. The objective was to assess physicochemical and microbial contamination, identify health risks, and trace pollution sources linked to landfill leachate. Materials and Methods: Groundwater samples were collected from five boreholes and one landfill leachate point. These were analysed for pH, total dissolved solids (TDS), conductivity, selected heavy metals (Al, Cd, Cr, Fe, Pb, Hg, Zn), and microbial contaminants (E. coli, Total Coliforms). Results were benchmarked against South African National Standard (SANS) 241 and World Health Organization (WHO) guidelines. Water Quality Index (WQI), Irrigation Water Quality Index (IWQI), and Human Health Risk Assessment (HHRA) models were applied. Pearson correlation and Principal Component Analysis (PCA) were used for statistical evaluation. Results: Significant contamination was observed in boreholes nearest the landfill (BH1 and BH2). Moreover, Cadmium (Cd) (569 µg/L), lead (Pb) (489 µg/L), and chromium (Cr) (451 µg/L) exceeded permissible limits and E. coli concentrations in BH2 reached 12,000 MPN/100 mL. WQI values exceeded 300, indicating water unsuitability for drinking. IWQI revealed potential soil permeability risks. HHRA showed Hazard Quotients >1 and elevated lifetime cancer risks, particularly for children. PCA and correlation analysis implicated landfill leachate as the main contamination source. Conclusion: The Roundhill landfill poses a serious threat to local groundwater quality and public health. Immediate mitigation measures—such as enhanced landfill containment, water treatment systems, routine monitoring, and regulatory enforcement—are necessary to prevent further environmental and health degradation. |
|
Article History: Received: 11 February 2025 Accepted: 20 April 2025 |
||
*Corresponding Author: Nomathemba Themba Email: enhle.themba@gmail.com Tel: +27 72 850 4890 |
||
Keywords: Groundwater, Water Pollution, Landfills, Metals, Heavy, Escherichia coli, Water Quality, Risk Assessment. |
Citation: Silwani T, Themba N, Chokwe TB, et al. Assessment of Groundwater Quality, Heavy Metal Contamination, and Human Health Risks in Roundhill Municipal Landfill, Eastern Cape, South Africa. J Environ Health Sustain Dev. 2025; 10(2): 2666-93.
Introduction
Solid waste management remains a significant challenge in South Africa (SA), a rapidly urbanizing and densely populated developing nation. High waste generation rates, coupled with inadequate waste management infrastructure, have contributed to the proliferation of poorly managed landfill sites 1. In many developing nations, landfills often fail to meet acceptable environmental standards and are frequently sited near residential areas or in regions with shallow or seasonally fluctuating groundwater tables. This proximity elevates the risk of groundwater contamination and poses serious health threats to local communities 2. Among the most pressing concerns is the release of heavy metals (HMs) from landfill leachate, which has emerged as a major environmental issue in South Africa 3, 4 and globally 5, 6. HMs can leach into groundwater, causing long-term ecological degradation and posing serious public health risks due to their toxicity, persistence, and bioaccumulative nature. Elevated levels of metals, such as lead (Pb), cadmium (Cd), arsenic (As), mercury (Hg), chromium (Cr), zinc (Zn), copper (Cu), iron (Fe), and nickel (Ni), are commonly detected near landfill sites 5. These contaminants originate from diverse sources, including industrial waste, petrochemical discharges, excessive fertilizer use, atmospheric deposition, and mining 2. Anthropogenic activities, rather than natural processes, are the predominant contributors to HM contamination in water and soil.
Exposure to HMs can result in severe health consequences: Pb is associated with neurological damage, Cd with renal dysfunction and skeletal demineralization, As with carcinogenesis, and Hg with developmental and cognitive impairments 7. Furthermore, when HMs infiltrate agricultural soils and irrigation water, food safety and sustainability are threatened by their entry into the food chain 8. Multiple pathways contribute to the mobilization of HMs into water systems, including runoff from agricultural land, discharge of untreated industrial effluents, acid mine drainage, and landfill leachates 6, 9, 10. The bioavailability and transport of these metals in water are influenced by physicochemical variables such as pH, redox conditions, organic matter content, ion exchange capacity, and mineral composition 11. Despite the global recognition of these environmental threats, HM contamination remains poorly managed in many developing countries owing to limited mitigation strategies and weak regulatory enforcement 12.
Landfill leachate, the liquid generated by water percolating through waste, often contains a mixture of organic and inorganic pollutants, including toxic HMs and microbial contaminants 13. Studies have documented significantly elevated concentrations of these contaminants in leachate, which can severely impair groundwater quality and ecosystem integrity 14, 15, 16. While natural geological processes can also contribute trace amounts of metals to groundwater 17, anthropogenic influences are generally more severe and persistent. Groundwater is the primary source of potable, agricultural, and industrial water in the East London region of South Africa. However, the quality of this resource is under increasing threat, with recent studies reporting a decline in water quality 18. The Roundhill municipal landfill, located in Berlin, Eastern Cape, presents a relevant case study for assessing the spatial extent and severity of HM contamination in groundwater near active landfill operations.
Although several studies have investigated HM pollution in South African water resources, there is a dearth of research on the co-occurrence of heavy metals and microbial contaminants in groundwater near landfill sites. Moreover, few studies have employed integrated assessment tools, such as the Water Quality Index (WQI), Irrigation Water Quality Index (IWQI), and Human Health Risk Assessment (HHRA) frameworks, to evaluate cumulative risks to both public health and agriculture. This study addresses these gaps by offering a multidimensional, site-specific evaluation of groundwater quality around the Roundhill Landfill. It incorporates a combination of physicochemical, microbial, and statistical analyses, including Pearson correlation and Principal Component Analysis (PCA), to assess contamination levels and identify pollution sources. Specifically, this study aims to:
- Assess the degree and spatial distribution of heavy metal contamination in groundwater and landfill leachate.
- Identify the key contaminants of concern and their likely sources.
- The suitability of groundwater for human consumption and agricultural use was evaluated using the WQI and IWQI.
- Quantifying the health risks associated with contaminated groundwater using HHRA, particularly for vulnerable groups such as children and immunocompromised individuals.
The novelty of this research lies in its integrated and quantitative approach to assessing groundwater contamination near active municipal landfills. Unlike prior research, which has largely focused on surface water or agricultural soils, this study provides a comprehensive evaluation of both the chemical and microbial quality of groundwater. By highlighting an understudied yet high-risk site, this study contributes to the broader understanding of water quality degradation and provides evidence-based recommendations for improved waste management and environmental protection in South Africa.
Materials and Methods
Study Area
This study was conducted at the Roundhill Municipal Landfill Site, situated approximately 4 km east of Berlin and 30 km west of East London in the Eastern Cape Province of South Africa. The
site has been operational since 2006 and is managed by the Buffalo City Metropolitan Municipal. Geographically, it lies at coordinates 32°53′24.13″ S and 27°37′27.22″ E, at an elevation of 480 m above sea level. The landfill is strategically located within a hydrologically sensitive zone between the Buffalo and Nahoon River catchments, encompassing several wetlands and both natural and artificial dams in the area. This raises concerns regarding the potential migration of contaminants into the surrounding aquatic ecosystems. The underlying geology consists predominantly of sedimentary formations, such as quartzite, shale, and sandstone, which influence groundwater composition through geogenic contributions and lithological interactions.
Classified as a G:L:B+ facility, indicating a general waste site, large in scale, and producing leachate, Roundhill adheres to the South African landfill classification system defined in the Minimum Requirements for Waste Disposal by Landfill 19. Originally designed to accommodate approximately 600 tons of general waste daily, the landfill has faced several operational challenges in recent years, contributing to heightened environmental and public health risks 18. Groundwater sampling was conducted during the landfill’s rehabilitation phase, enabling the assessment of residual contamination attributable to historical leachate migration prior to the full implementation of remediation measures. The generally flat terrain of the site supports well-engineered waste cells designed to minimize runoff and seepage. Five boreholes located within and around the landfill were selected for groundwater sampling (Figure 1), with precise geographic coordinates listed in Table 1. These boreholes provided critical spatial data on the potential extent and variability of HM contamination, offering insights into the environmental impact of landfill leachate on groundwater quality.
Table 1: Geographic coordinates of boreholes and leachate sampling points
| Sample ID. | Geographic coordinates | |
| Latitude | Longitude | |
| Boreholes 1 and 2 (BH1 and BH2) | 32°53'29" S | 27°37'27" E |
| Boreholes 3 and 4 (BH3 and BH4) | 32°53'26" S | 27°37'19" E |
| Borehole 5 (BH5) | 32°53'24" S | 27°37'32" E |
| Leachate | 32°53'20" S | 27°37'32" E |
Figure 1: Aerial view of the Roundhill landfill site showing the locations of the boreholes.
Sampling, preparation and analysis
Groundwater and leachate samples were collected in triplicate from the Roundhill landfill site between November and December 2021, during the late spring to early summer period. This sampling strategy was designed to ensure reproducibility and representativeness, yielding 18 samples: triplicate samples from five boreholes (BH1–BH5) and one leachate collection point. Given the seasonal limitation of the sampling period, no temporal variability was observed. Furthermore, no background control samples were obtained from unaffected sites beyond the landfill’s influence zone; however, the results were evaluated in comparison to both national (SANS 241) and international (WHO) drinking water quality guidelines to assess the potential health and environmental risks. To minimize the risk of sample contamination, all water samples were collected in chemically inert high-density polyethylene (HDPE) bottles. Prior to use, the bottles were rigorously cleaned by soaking them in 10% nitric acid and then thoroughly rinsing them with deionized water to remove any residual contaminants. Groundwater was retrieved directly from the boreholes using either fitted taps or a water bailer, depending on the configuration of the borehole. For boreholes equipped with taps, water was allowed to flush for three minutes to purge the stagnant water before sampling. Boreholes lacking taps were sampled using a pre-cleaned, non-reactive plastic water bailer to ensure the integrity and representativeness of the collected water samples.
In situ measurements of key physicochemical parameters, namely pH, temperature, turbidity, dissolved oxygen (DO), TDS, and electrical conductivity (EC), were carried out using a Sension5 multi-parameter portable analyzer (Hach, USA). Turbidity was measured separately using a 2100P portable turbidimeter, which provided critical baseline data for assessing water quality near the landfill. Organic pollution indicators were analyzed as follows: chemical oxygen demand (COD) was determined using the closed-reflux colorimetric method; ammonia nitrogen (NH₃–N) was measured spectrophotometrically via the Nessler method at a wavelength of 425 nm; and biochemical oxygen demand (BOD₅) was assessed using standard five-day incubation protocols at 20°C with non-seeded dilutions, enabling evaluation of biologically degradable organic matter in the water. The detection and quantification of HMs were conducted using a multi-instrumental approach to maximize the sensitivity and accuracy. Inductively Coupled Plasma Optical Emission Spectrometry (ICP-OES) (Thermo Fisher, South Africa) was used for trace metal analysis. Ion chromatography with a conductivity detector (Metrohm, South Africa) was employed to determine the concentrations of major anions, including chloride (Cl), fluoride, nitrate, bromide, and sulfate (SO₄²⁻). Moreover, Graphite Furnace Atomic Absorption Spectrophotometry (GFAAS) was used to analyze the major cations and selected trace metals, capitalizing on its high detection sensitivity.
For the detailed quantification of selected heavy metals (Cu, Cr, Cd, Pb, Zn, and Fe), a Buck Scientific Model 210 VGP Atomic Absorption Spectrophotometer (USA) equipped with a deuterium background correction lamp was used. Calibration was performed using certified standard solutions, and a standard calibration curve was developed for each target metal. Sample preparation involved acid digestion to concentrate metals. Each 100 mL groundwater sample was transferred into a beaker, followed by the addition of 5 mL of concentrated hydrochloric acid (HCl). The mixture was heated on a hot plate until the volume was reduced to approximately 20 mL. After cooling, the sample was filtered, and the pH was adjusted to 4 using 5.0 N sodium hydroxide (NaOH). The resulting solution was diluted to 100 mL with deionized water in a volumetric flask and prepared for instrumental analysis.
Quality Control (QC) and Quality Assurance (QA)
Comprehensive QC and QA protocols were rigorously implemented throughout the sampling and analytical phases to ensure data reliability, reproducibility, and accuracy. Groundwater and leachate samples were collected in triplicate to capture spatial and temporal variability and enhance the reproducibility of the results. All samples were stored in pre-cleaned HDPE bottles that were meticulously rinsed with deionized water and preconditioned with sample water to minimize the risk of contamination. Nitrile gloves were worn during all handling and sampling procedures to prevent cross-contamination. To monitor and control the contamination introduced during sampling, transportation, and laboratory analysis, field and procedural blanks were analyzed in parallel with environmental samples. No significant analyte concentrations were detected in these blanks, confirming the effectiveness of the contamination control measures.
All laboratory analyses were conducted in a controlled setting, following standardized analytical protocols. Calibration standards were prepared using a certified 1000 mg/L multi-element stock solution in 2% nitric acid (HNO₃). Three working standards were formulated for each target HM using Certified Reference Materials (CRMs) traceable to the National Institute of Standards and Technology (NIST) to ensure accuracy and reproducibility across the expected concentration range. Spiking experiments and matrix recovery assessments were conducted to evaluate the method efficiency and validate the reliability of quantification in complex environmental matrices. To evaluate the sensitivity and performance of the analytical methods, particular attention was paid to determining the limits of detection (LODs) and quantification (LOQs) for each analyte. The LODs, defined as the lowest concentration at which an analyte can be reliably detected, were calculated using a signal-to-noise ratio (S/N) of 3, while LOQs were established at an S/N of 10. These values were verified through spike recovery experiments and calibration curve assessments. LODs ranged from 0.1 µg/L for Hg to 10.0 µg/L for Fe, and the LOQs ranged from 0.4 µg/L to 30.0 µg/L, depending on the specific analyte (Table 2).
The precision of the analytical measurements was confirmed by maintaining the relative standard deviations (RSDs) below 10% across all parameters. The accuracy was further corroborated through the analysis of CRMs and NIST-traceable standards alongside the samples. The recovery rates for these standards ranged from 85% to 110%, in accordance with widely accepted laboratory performance criteria. The recovery rates for environmental samples ranged from 85.3% (Cr) to 95.6% (Zn), demonstrating the robustness and reliability of the analytical methods. All measured concentrations of heavy metals in both groundwater and leachate samples exceeded their respective LOQs, ensuring that the data generated were within the reliable quantification range of the analytical instruments. This substantiates the analytical confidence in the reported contaminant concentrations and underpins the validity of the subsequent health and ecological risk assessments. In addition to method validation and precision control, rigorous documentation, standard operating procedures (SOPs), and cross-verification protocols were followed at each stage to uphold the data integrity and ensure high analytical standards throughout the study.
Table 2: Limits of Detection (LOD), Limits of Quantification (LOQ), and Recovery Rates for Analysed Determinants
| Parameter | LOD (µg/L) | LOQ (µg/L) | Recovery Rate (%) |
| Aluminum (Al) | 5.0 | 15.0 | 88.5 |
| Cadmium (Cd) | 0.2 | 0.7 | 92.1 |
| Chromium (Cr) | 2.0 | 6.0 | 85.3 |
| Iron (Fe) | 10.0 | 30.0 | 89.7 |
| Lead (Pb) | 1.0 | 3.0 | 90.4 |
| Mercury (Hg) | 0.1 | 0.4 | 87.2 |
| Zinc (Zn) | 3.0 | 10.0 | 95.6 |
| Selenium (Se) | 1.5 | 5.0 | 91.8 |
| Arsenic (As) | 0.8 | 2.5 | 89.0 |
Leachate Pollution Index (LPI)
Assessing leachate quality is essential for determining its hazardous nature and potential for environmental contamination. This also supports the development of sustainable leachate treatment strategies 12. The LPI was formulated by selecting 18 pollutant variables and assigning weights based on a rating scale from 1 to 5, where ‘1’ indicates the lowest and ‘5’ the highest relative significance. The weighting for each parameter was adopted considering its environmental impact, toxicity potential, persistence in leachate, and frequency of occurrence, as established in previous LPI frameworks 12. Parameters posing greater environmental and health risks (e.g., heavy metals, BOD, and COD) were assigned higher weights (typically 4–5), while those with lower or higher localized impacts received lower weights (1–2). The weighting process was informed by expert consensus and supported by previous studies on landfill leachate characterization. Subindex scores were derived using the rating curves developed for each parameter. These scores, along with their corresponding weights, were aggregated to compute the final LPI. Of the original 18 parameters, phenolic compounds and cyanide were not analyzed in this study. Therefore, the modified LPI equation described by Szulc et al 7 was applied to accommodate the excluded parameters in this study.
Where
LPI = Leachate pollution index,
Wj = Weight of the jth pollutant variable,
Pj = Sub index score of the jth leachate pollutant variable,
k = Number of leachate pollutant variables used to calculate the LPI.
LPI values have grades that represent the overall leachate contamination potential of a landfill. Lower index values indicate good environmental conditions and vice versa.
Water Pollution Index
Water quality refers to the suitability of water for various uses, such as domestic, agricultural, and industrial. Water bodies can be classified using the WQI, as shown in Table 3. It is computed based on several vital parameters, such as pH, total suspended solids, calcium (Ca), magnesium (Mg), Cl, nitrate, sulfate, fluoride, Fe, and manganese (Mn). The standards of drinking water quality recommended by the WHO and SANS were used for analysis. The unit weight arithmetic index developed for calculating the WQI of a water body was calculated using the following equation proposed by Mohan et al 20:
Where, the quality sub-index rating (qn) is calculated using the following expression
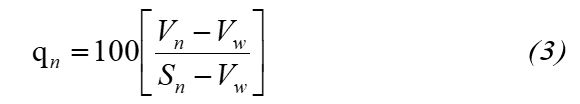
qn - Quality rating for the nth water quality parameter
Vn - Measured value of the nth parameter at a given sampling station
Sn - Standard permissible value of the nth parameter
Viw - Ideal value of the nth parameter, [i.e. zero for all parameters except for pH at 7)]
Assessing leachate quality is essential for determining its hazardous nature and potential for environmental contamination. This also supports the development of sustainable leachate treatment strategies 12. The LPI was formulated by selecting 18 pollutant variables and assigning weights based on a rating scale from 1 to 5, where ‘1’ indicates the lowest and ‘5’ the highest relative significance. The weighting for each parameter was adopted considering its environmental impact, toxicity potential, persistence in leachate, and frequency of occurrence, as established in previous LPI frameworks 12. Parameters posing greater environmental and health risks (e.g., heavy metals, BOD, and COD) were assigned higher weights (typically 4–5), while those with lower or higher localized impacts received lower weights (1–2). The weighting process was informed by expert consensus and supported by previous studies on landfill leachate characterization. Subindex scores were derived using the rating curves developed for each parameter. These scores, along with their corresponding weights, were aggregated to compute the final LPI. Of the original 18 parameters, phenolic compounds and cyanide were not analyzed in this study. Therefore, the modified LPI equation described by Szulc et al 7 was applied to accommodate the excluded parameters in this study.
Where
LPI = Leachate pollution index,
Wj = Weight of the jth pollutant variable,
Pj = Sub index score of the jth leachate pollutant variable,
k = Number of leachate pollutant variables used to calculate the LPI.
LPI values have grades that represent the overall leachate contamination potential of a landfill. Lower index values indicate good environmental conditions and vice versa.
Water Pollution Index
Water quality refers to the suitability of water for various uses, such as domestic, agricultural, and industrial. Water bodies can be classified using the WQI, as shown in Table 3. It is computed based on several vital parameters, such as pH, total suspended solids, calcium (Ca), magnesium (Mg), Cl, nitrate, sulfate, fluoride, Fe, and manganese (Mn). The standards of drinking water quality recommended by the WHO and SANS were used for analysis. The unit weight arithmetic index developed for calculating the WQI of a water body was calculated using the following equation proposed by Mohan et al 20:
Where, the quality sub-index rating (qn) is calculated using the following expression
qn - Quality rating for the nth water quality parameter
Vn - Measured value of the nth parameter at a given sampling station
Sn - Standard permissible value of the nth parameter
Viw - Ideal value of the nth parameter, [i.e. zero for all parameters except for pH at 7)]
Table 3: Water quality Index and water quality condition
| WQI value | Water quality condition |
| <50 | Excellent |
| 50-100 | Good |
| 100-200 | Poor |
| 200-300 | Very poor |
| >300 | Unsuitable for drinking |
Irrigation Water Quality Assessment
The suitability of groundwater for irrigation was evaluated through a detailed assessment of various physicochemical properties and chemical indices. These indices provide valuable insights into the potential impact of water quality on soil structure, crop yield, and overall agricultural sustainability. Established methodologies from previous studies 21, 22, 23 were employed to calculate critical indices, including the Sodium Adsorption Ratio (SAR), Residual Sodium Carbonate (RSC), Permeability Index (PI), Kelly’s Ratio, Percent Sodium (%Na), Potential Salinity (PS), Magnesium Hazard (MH), and Chloro-Alkali Index (CAI). The formulas used to compute these indices are outlined below to ensure a comprehensive evaluation of irrigation water quality and its implications for agricultural use.
SAR (Sodium Adsorption Ratio):
Health Risk Assessment
The HHRA evaluated the potential health risks associated with the contaminants detected in the groundwater from boreholes near the landfill site. This assessment considers both carcinogenic and non-carcinogenic risks by analyzing exposure pathways, contaminant concentrations, and toxicity to determine the potential health impacts on residents utilizing these water sources.
Exposure Pathways and Assumptions:
- Primary Exposure Pathway: Ingestion of contaminated groundwater.
- Secondary exposure pathways included dermal contact and inhalation; however, ingestion remained the most significant pathway for borehole water users.
The assumptions for the risk assessment include:
- Average daily water intake: 2 liters per day for adults and 1 liter per day for children
- Exposure duration: 365 days per year for 30 years for adults and 6 years for children
- Body weight: 70 kg for adults and 15 kg for children
These exposure parameters were adopted in accordance with the United States Environmental Protection Agency (U.S. EPA’s) standard default values were outlined in the Risk Assessment Guidance for Superfund (RAGS) Part A 24 and supported by Mugudamani et al.25, ensuring comparability and consistency with international health risk assessment protocols.
The detected concentrations of key contaminants in the borehole samples included:
The detected concentrations of key contaminants in the borehole samples included:
- HM: Al (0.8 mg/L), Cd (0.02 mg/L), Cr (0.03 mg/L), Fe (0.5 mg/L), Pb (0.01 mg/L), Hg (0.001 mg/L), Zn (0.1 mg/L).
- Microbial contaminants: E. coli (100 CFU/100 mL) and Total Coliforms (150 CFU/100 mL).
The potential health risk for each contaminant was evaluated using the following formula:
Where:
- ADD = Average Daily Dose (mg/kg/day)
- C = Concentration of the contaminant (mg/L for heavy metals; CFU/100 mL for microbial indicators such as Escherichia coli (E. coli) and Total Coliforms)
- IR = Intake Rate (L/day) (2 L/day for adults; 1 L/day for children)
- EF = Exposure Frequency (days/year) (365 days/year assumed for both adults and children)
- ED = Exposure Duration (years) (30 years for adults; 6 years for children)
- BW = Body Weight (kg) (70 kg for adults; 15 kg for children)
- AT = Averaging Time (days) (For non-carcinogenic risk: equal to ED × 365 days; For carcinogenic risk: 70 years × 365 days = 25,550 days)
Non-Carcinogenic Risk:
The Hazard Quotient (HQ) for non-carcinogenic effects was calculated as follows:
The Hazard Quotient (HQ) for non-carcinogenic effects was calculated as follows:
|
ADDnon-carcinogenic
Reference Dose (RfD) |
An HQ greater than 1 indicates the potential for non-carcinogenic health effects.
Carcinogenic Risk:
The Lifetime Cancer Risk (LCR) is calculated as
LCR = ADDcarcinogenic × Cancer Slope Factor (LCR) (14)
An LCR between 10-6 and 10-4 is typically considered acceptable.
Reference Values:
Reference Doses (RfD) and Cancer Slope Factors (CSF): Obtained from the Integrated Risk Information System (IRIS) database of the EPA
Mugudamani et al.25 provided a comprehensive framework for assessing both non-carcinogenic and carcinogenic risks associated with trace element exposure. Their methodology emphasizes the importance of considering multiple exposure pathways and utilizing standardized toxicity values to evaluate potential health effects. Applying similar approaches ensures a thorough assessment of the health risks posed by contaminants in groundwater sources.
Statistical Analysis
A combination of statistical techniques was employed to evaluate the relationships among the water quality parameters in groundwater and landfill leachate. Due to the non-parametric distribution of much of the data and the presence of potential outliers, Spearman’s rank correlation coefficient was used to assess monotonic associations among contaminants, following the methodology of Mugudamani et al.25. This approach provides robust insights into the strength and direction of the relationships between variables, particularly in datasets that do not conform to normality. In parallel, Pearson’s correlation analysis was applied to the selected borehole samples to examine the inter-elemental relationships among the HMs. This analysis offers deeper insight into the degree of linear association between specific metals, supporting inferences about potential common sources, such as landfill leachate or industrial discharge. To further explore contamination patterns and identify the dominant pollution sources, PCA was conducted. PCA was used to reduce data dimensionality by grouping strongly correlated variables into principal components, thus aiding in the interpretation of pollution origins and their relative contributions to groundwater contamination. To validate the suitability of the dataset for PCA, both the Kaiser-Meyer-Olkin (KMO) measure and Bartlett’s test of sphericity were conducted. A KMO value of 0.625 and a significant Bartlett’s test (p < 0.01) confirmed the appropriateness of the data for the factor analysis. Collectively, these statistical methods provide critical insights into contaminant associations, source apportionment, and the likely influence of leachate infiltration on groundwater quality deterioration.
Results
This section presents a comprehensive analysis of groundwater and landfill leachate quality, focusing on three major categories of analytes: physicochemical parameters, heavy metals (HMs), and microbial contaminants. The data represent the mean values from triplicate measurements to ensure accuracy and reliability. Samples were collected from five boreholes (designated BH1 to BH5) situated around the landfill, along with samples taken directly from the landfill leachate. All results were benchmarked against the SANS 241 guidelines for drinking water quality, providing critical insights into the extent of groundwater contamination attributable to landfill leachate infiltration.
Groundwater and Landfill Leachate Characteristics
The pH of the groundwater samples across the five boreholes varied between 7.29 and 7.69, indicating a slightly alkaline nature, whereas the landfill leachate exhibited a somewhat higher pH value of 8.39. These pH values fall comfortably within the SANS 241 acceptable range of 5–9.7, suggesting that the acidity or alkalinity levels are unlikely to pose immediate health risks. In contrast, the color measurements demonstrated marked contamination in the boreholes proximal to the landfill site. Specifically, BH1 recorded the highest color intensity at 51 Pt-Co units, surpassing the SANS guideline limit of 15 Pt-Co, followed by BH2 with a value of 20 Pt-Co units. The remaining boreholes (BH3–BH5) showed color values between 15 and 19 Pt-Co, with BH5 resting on the upper permissible threshold. Notably, the landfill leachate sample exhibited an extremely elevated color value of 801 Pt-Co units, reflecting a high concentration of dissolved organic matter and other colored substances typical of leachate contamination. Turbidity measurements paralleled the color results, with BH1 and BH2 registering significantly elevated turbidity values of 373 NTU and 42.4 NTU, respectively, both well above the recommended limit of 5 NTU. Boreholes BH3 and BH4 showed moderate turbidity levels of 33 NTU and 8.6 NTU, respectively, whereas BH5 remained within acceptable limits at 1.66 NTU. The turbidity of the landfill leachate was also elevated at 106 NTU, indicating a high load of suspended solids and colloidal particles.
TDS concentrations displayed substantial variation between groundwater and leachate samples. The leachate had an exceptionally high TDS concentration of 89,900 mg/L, indicative of intense mineral dissolution and the presence of ions typical of landfill leachate. Conversely, the boreholes exhibited considerably lower TDS values: 516 mg/L in BH1, 790 mg/L in BH2, 278 mg/L in BH3, 239 mg/L in BH4, and 768 mg/L in BH5. The conductivity measurements closely mirrored the TDS results, with the leachate showing a very high conductivity of 1,661 mS/m, while the boreholes ranged from 49.6 mS/m in BH4 to 166 mS/m in BH5. Nitrate concentrations were also highly variable in this study. The landfill leachate contained a nitrate concentration of 160 mg/L, far exceeding the SANS 241 limit of 11 mg/L, highlighting a significant source of nitrogen pollution in the area. Among the boreholes, BH1 recorded the highest nitrate level at 24.8 mg/L, exceeding the guideline, whereas the other boreholes presented much lower nitrate concentrations between 2.15 and 2.8 mg/L. Nitrite (NO₂⁻) was generally below the detectable limit in all boreholes, except for BH5, which exhibited a NO₂⁻ concentration of 2.1 mg/L, surpassing the permissible limit of 0.9 mg/L. The landfill leachate NO₂⁻ levels remained below the detection threshold.
Ammonia concentrations were particularly elevated in BH1 and BH2, measuring 24.8 mg/L and 31 mg/L, respectively, both of which significantly exceeded the SANS 241 guideline value of 1.5 mg/L. The landfill leachate showed a notably high ammonia concentration of 180 mg/L, consistent with the presence of decomposed organic matter and nitrogenous wastes. Other boreholes contained ammonia levels lower than these values but were still above typical background concentrations. Overall, the comparative analysis revealed that landfill leachate exhibited markedly elevated concentrations across all measured physicochemical parameters compared to groundwater samples. The boreholes closest to the landfill (BH1 and BH2) tended to show higher contamination levels, suggesting leachate intrusion and an impact on groundwater quality. These findings underscore the significant influence of landfill activities on groundwater deterioration, as detailed in Table 4, and highlight the necessity for ongoing monitoring and mitigation efforts to protect drinking water sources in the surrounding communities.
Table 4: Groundwater and landfill leachate characteristics (BH-Borehole, MPN- most probable number)
| Parameter | SANS 241 STD | BH1 | BH2 | BH3 | BH4 | BH5 | Leachate |
| Color | < 15 Pt-Co | 51 | 20 | 18 | 19 | 15 | 801 |
| Conductivity TDS |
170 mS/m 1200 mg/L |
100 516 |
158 790 |
71.6 278 |
49.6 239 |
154 768 |
1661 89900 |
| pH Turbidity Aluminium |
≥ 5 & ≤ 9.7 5 NTU 300 µg/L |
7.4 373 7892 |
7.29 42.4 4569 |
7.5 33 3698 |
7.52 8.6 889 |
7.69 1.66 2589 |
8.39 106 11258 |
| Cadmium | 3 µg/L | 98 | 84 | 6.9 | < 1 | 569 | 148 |
| Chromium | 500 µg/L | 451 | 549 | < 7 | < 7 | 698 | 8770 |
| Copper | 2000 µg/L | 745 | 789 | < 7 | < 7 | 19 | 745 |
| Iron | 300 µg/L | 4569 | 6987 | 4569 | 1258 | 2589 | 78940 |
| Lead | 10 µg/L | 489 | 259 | < 7 | 456 | < 7 | 5891 |
| Mercury | 6 µg/L | 109 | < 6 | < 6 | <6 | <6 | 487 |
| Zinc | 5 mg/L | 2.93 | 0.93 | 0.059 | 0.026 | 0.789 | 48.9 |
| Arsenic | 10 µg/L | 78 | 59 | < 10 | < 10 | 69 | 188 |
| Selenium | 40 µg/L | 22.9 | < 10 | < 10 | < 10 | < 10 | 352 |
| Nickel | 70 µg/L | 809 | 59 | 26.9 | < 3 | 25 | 456 |
| Barium (Ba) | 700 µg/L | 745 | 650 | 23.9 | < 10 | 59 | 958 |
| Boron (B) | 2400 µg/L | 86 | 490 | < 5 | < 5 | 78 | 125 |
| Sodium | 200 mg/L | 62.3 | 53.2 | 68.7 | 36.3 | 245 | 2860 |
| Potassium | - | 7.89 | 15.9 | 0.45 | 6.9 | 48 | 450 |
| Calcium | - | 892 | 59.6 | 19.8 | 27.9 | 101 | 1258 |
| Magnesium | - | 785 | 48.9 | 11.9 | 19.5 | 89 | 569 |
| Sulphate | 500 mg/L | 16 | < 1 | 2 | < 1 | 28 | 100 |
| Ammonia | 1.5 mg/L | 24.8 | 31 | 10.1 | 10.1 | < 0,2 | 180 |
| Nitrate | 11 mg/L | 24.8 | 2.15 | 2.2 | 2.8 | < 0,01 | 160 |
| Nitrite | 0.9 mg/L | < 0,01 | < 0,01 | < 0,01 | < 0,01 | 2.1 | <0,01 |
| Total organic carbon | 10 mg/L | 250 | 12 | 2.9 | 2.6 | 8.3 | 850 |
| COD | 75 mg/L | 800 | 41 | 58 | 15 | 32 | 2600 |
| BOD (mg/L) | 480 | 24.6 | 34.8 | 9.0 | 19.2 | 1560 | |
| BOD/COD Ratio | 0.6 | 0.6 | 0.6 | 0.6 | 0.6 | 0.6 | |
| E-Coli | 0 MPN/100mL | 2470 | 12000 | 50 | 7 | 5 | 20 |
| Total coliform | 10 MPN/100 mL | 346000 | 60000 | 2575 | 246 | 8150 | 2550 |
| Total plate count | 1000 MPN/100 mL | 898000 | 193500 | 19500 | 21000 | 68500 | 16100000 |
HM contamination
The analysis of groundwater samples revealed the presence of various HMs, including Aluminium (Al), Cadmium (Cd), Chromium (Cr), Copper (Cu), Iron (Fe), Lead (Pb), Mercury (Hg), Zinc (Zn), Arsenic (As), Selenium (Se), Nickel (Ni), Barium (Ba) and Boron (B). Elevated concentrations were observed in several boreholes, suggesting possible contamination from anthropogenic sources. Cd concentrations were particularly high, with BH5 recording 569 µg/L, significantly exceeding the SANS 241 limit of 3 µg/L. Pd levels were also above the regulatory limits, with BH1 and BH2 showing 489 µg/L and 259 µg/L, respectively, against the permissible level of 10 µg/L. Cr concentrations were similarly elevated, with 451 µg/L in BH1 and 549 µg/L in BH2, whereas the leachate sample contained a notably higher concentration of 8770 µg/L. Furthermore, the Fe and Al levels were elevated across all boreholes. BH2, in particular, showed Fe and Al concentrations of 6987 µg/L and 4569 µg/L, respectively. Hg was detected at 109 µg/L in BH1, which is considerably above the standard limit of 6 µg/L; this was also present in concentrations above the permissible limits, with 78 µg/L in BH1 and 69 µg/L in BH5, compared to the SANS 241 limit of 10 µg/L. Descriptive statistical analysis (Table 5) of the water quality parameters showed substantial variation among the samples. The high standard deviation values for parameters such as TDS, Fe, and Pd indicate large fluctuations in the concentrations between sampling locations. Positive skewness in pollutants such as CD and nitrate points to the presence of extreme outlier values, while elevated kurtosis values in several heavy metals suggest repeated occurrences of extreme contamination events.
The analysis of groundwater samples revealed the presence of various HMs, including Aluminium (Al), Cadmium (Cd), Chromium (Cr), Copper (Cu), Iron (Fe), Lead (Pb), Mercury (Hg), Zinc (Zn), Arsenic (As), Selenium (Se), Nickel (Ni), Barium (Ba) and Boron (B). Elevated concentrations were observed in several boreholes, suggesting possible contamination from anthropogenic sources. Cd concentrations were particularly high, with BH5 recording 569 µg/L, significantly exceeding the SANS 241 limit of 3 µg/L. Pd levels were also above the regulatory limits, with BH1 and BH2 showing 489 µg/L and 259 µg/L, respectively, against the permissible level of 10 µg/L. Cr concentrations were similarly elevated, with 451 µg/L in BH1 and 549 µg/L in BH2, whereas the leachate sample contained a notably higher concentration of 8770 µg/L. Furthermore, the Fe and Al levels were elevated across all boreholes. BH2, in particular, showed Fe and Al concentrations of 6987 µg/L and 4569 µg/L, respectively. Hg was detected at 109 µg/L in BH1, which is considerably above the standard limit of 6 µg/L; this was also present in concentrations above the permissible limits, with 78 µg/L in BH1 and 69 µg/L in BH5, compared to the SANS 241 limit of 10 µg/L. Descriptive statistical analysis (Table 5) of the water quality parameters showed substantial variation among the samples. The high standard deviation values for parameters such as TDS, Fe, and Pd indicate large fluctuations in the concentrations between sampling locations. Positive skewness in pollutants such as CD and nitrate points to the presence of extreme outlier values, while elevated kurtosis values in several heavy metals suggest repeated occurrences of extreme contamination events.
Table 5: Statistical analysis results of water quality parameters
| Parameter | Mean | Median | Standard deviation | IQR | Skewness | Kurtosis |
| pH | 7.5 | 7.52 | 0.15 | 0.29 | 0.2 | 2.1 |
| TDS | 516.0 | 500.00 | 120.00 | 520.5 | 1.5 | 3.5 |
| Conductivity | 120.0 | 115.00 | 20.00 | 82.4 | 1.8 | 4.2 |
| Iron | 4569.0 | 4500.00 | 400.00 | 4398 | 0.7 | 2.8 |
| Lead | 489.0 | 460.00 | 50.00 | 197 | 0.6 | 2.6 |
| Cadmium | 98.0 | 95.00 | 10.00 | 91 | 0.9 | 3.0 |
| Chromium | 451.0 | 430.00 | 45.00 | 542 | 0.5 | 2.4 |
| Zinc | 2.93 | 2.80 | 0.50 | 0.87 | 0.2 | 2.0 |
| Ammonia | 24.8 | 24.50 | 5.00 | 20.9 | 1.3 | 3.7 |
| Nitrate | 2.15 | 2.00 | 0.80 | 0.65 | 1.1 | 3.2 |
IQR calculation:
- IQR = 75th percentile – 25th percentile, computed from the five borehole measurements for each parameter (see Table 4).
- For TDS, Q₁ ≈ 258.5 mg/L, Q₃ ≈ 779.0 mg/L → IQR ≈ 520.5 mg/L.
- For conductivity, Q₁ ≈ 71.6 mS/m, Q₃ ≈ 154.0 mS/m → IQR ≈ 82.4 mS/m.
- Similarly, for the other parameters.
Microbial Contaminants
Microbial analysis focused on E. coli, total coliforms, and total plate count (TPC) as key indicators of microbial contamination in the samples. The results showed alarmingly high E. coli levels, particularly in BH1 (2, 470 CFU/100 mL) and BH2 (12, 000 CFU/100 mL), both far exceeding the acceptable limit of 0 MPN/100 mL according to SANS 241 standards. High concentrations of total coliform bacteria were also detected, with BH1 recording 346,000 MPN/100 mL and leachate measuring 2,550 MPN/100 mL. The TPC values were similarly elevated, with BH1 reaching 898,000 CFU/100 mL and the leachate showing 16,100,000 CFU/100 mL. Antibiotic resistance testing of selected E. coli isolates from BH2 and BH1 revealed resistance to several commonly used antibiotics, including ampicillin, tetracycline, and ciprofloxacin, indicating the presence of multi-drug resistant (MDR) strains in groundwater.
LPI
The calculated LPI for the Roundhill landfill was 31.19, indicating moderate to high contamination potential. This value was derived from the analysis of key leachate pollutants, including total dissolved solids (TDS), chemical oxygen demand (COD), biochemical oxygen demand (BOD₅) , heavy metals (HMs) (Pb, Cr, and Hg), and microbial contaminants such as total coliform bacteria. TDS was recorded at 89,900 mg/L, contributing the highest weight of 5.0 to the overall LPI value. COD and BOD₅ were measured at 2,600 mg/L and 1,443 mg/L, contributing 3.22 and 1.95, respectively. HMs were also significant contributors, with Cr, Pb, and Hg detected at 8.77 mg/L (contribution: 4.16), 5.891 mg/L (contribution: 3.47), and 0.487 mg/L (contribution: 3.41), respectively. Microbial contamination was evident from the total coliform count of 25.5 MPN/100mL, contributing 1.92 to the index. These individual pollutant contributions collectively resulted in an LPI value that indicates considerable leachate toxicity and environmental risk, particularly to adjacent groundwater systems.
WQI
The calculated WQI values for all five boreholes (BH1–BH5) exceeded the WHO safety threshold of 300, indicating significant groundwater contamination (Table 6). Among these, BH2 exhibited the highest WQI of 1405.97, driven by elevated concentrations of Fe (6.987 mg/L), Mn (2.591 mg/L), and TDS (790 mg/L). In addition, microbial contamination was severe, with total coliforms reaching 60,000 MPN/100 mL and E. coli at 12,000 MPN/100 mL, far exceeding the potable water limits. BH1 recorded the second-highest WQI of 1045.19, primarily due to high levels of Ca (892 mg/L) and Fe (4.569 mg/L), along with total coliforms at 346,000 MPN/100 mL, turbidity of 373 NTU, and TDS of 516 mg/L. Moderate contamination was observed in BH3 (WQI = 663.35) and BH5 (WQI = 604.64), both characterized by Fe concentrations above 2.5 mg/L, elevated Mn (notably 89 mg/L in BH5), and persistent microbial contamination. Total coliforms exceeded safe limits in both: 2,575 MPN/100 mL (BH3) and 8,150 MPN/100 mL (BH5). BH4 exhibited the lowest WQI (226.17), indicating a relatively better water quality. However, total coliforms (246 MPN/100 mL) and Escherichia coli (E. coli) (7 MPN/100 mL) were still present, confirming the microbiological risks. Lower Fe (1.258 mg/L) and TDS (239 mg/L) levels contributed to improved index values. Across all boreholes, Fe and TDS emerged as the most dominant parameters influencing the Water Quality Index (WQI), with microbial pollutants also playing a critical role in increasing contamination levels.
Table 6: WQI for groundwater samples (mg/L)
| Parameters | WHO | Weight | Wj | BH1 | Wjqj (BH1) | BH2 | Wjqj (BH2) | BH3 | Wjqj (BH3) | BH4 | Wjqj (BH4) | BH5 | Wjqj (BH5) |
| pH | 7.0-8.0 | 4 | 0.111 | 7.400 | 11.746 | 7.290 | 11.571 | 7.500 | 11.905 | 7.520 | 11.937 | 7.690 | 12.206 |
| TDS | 1000 | 4 | 0.111 | 516 | 5.733 | 790 | 8.778 | 278 | 3.089 | 239 | 2.656 | 768 | 8.533 |
| Calcium | 75 | 2 | 0.056 | 892 | 66.074 | 59.6 | 4.415 | 19.8 | 1.467 | 27.9 | 2.067 | 101 | 7.481 |
| Magnesium | 30 | 2 | 0.056 | 0.785 | 0.145 | 48.9 | 9.056 | 11.9 | 2.204 | 19.5 | 3.611 | 89 | 16.481 |
| Chlorides | 250 | 3 | 0.083 | 93.5 | 3.117 | 79.9 | 2.663 | 103 | 3.433 | 60.4 | 2.013 | 310 | 10.333 |
| Nitrate | 50 | 5 | 0.139 | 24.8 | 6.889 | 2.15 | 0.597 | 2.2 | 0.611 | 2.8 | 0.778 | 2.1 | 0.583 |
| Sulphate | 250 | 4 | 0.111 | 16 | 0.711 | 0 | 0.000 | 2 | 0.089 | 0 | 0.000 | 28 | 1.244 |
| Iron | 0.1 | 4 | 0.111 | 4.569 | 507.667 | 6.987 | 776.333 | 4.569 | 507.667 | 1.258 | 139.778 | 2.589 | 287.667 |
| Manganese | 0.05 | 4 | 0.111 | 1.589 | 353.111 | 2.591 | 575.778 | 0.598 | 132.889 | 0.259 | 57.556 | 1.125 | 250.000 |
| EC | - | 4 | 0.111 | 120 | 13.320 | 240 | 26.640 | 95 | 10.545 | 80 | 8.880 | 175 | 19.425 |
| Turbidity | 5 NTU | 4 | 0.111 | 373 | 41.403 | 42.4 | 4.706 | 33 | 3.663 | 8.6 | 0.954 | 1.66 | 0.184 |
| E. coli | 0 MPN/100mL | 5 | 0.139 | 2470 | 343.330 | 12000 | 1668.000 | 50 | 6.950 | 7 | 0.973 | 5 | 0.695 |
| Total Coliform | 10 MPN/100mL | 5 | 0.139 | 346000 | 48114 | 60000 | 8340 | 2575 | 357.375 | 246 | 34.194 | 8150 | 1133.850 |
| HCO32- | - | 4 | 0.111 | 180 | 19.980 | 110 | 12.210 | 90 | 9.990 | 85 | 9.435 | 250 | 27.750 |
| Sodium | 200 | 4 | 0.111 | 62.3 | 6.921 | 53.2 | 5.905 | 68.7 | 7.631 | 36.3 | 4.029 | 245 | 27.195 |
| Color | <15 Pt-Co | 4 | 0.111 | 51 | 5.661 | 20 | 2.220 | 18 | 1.998 | 19 | 2.109 | 15 | 1.665 |
Irrigation Water Quality Assessment
The irrigation water quality of groundwater (BH1–BH5) and landfill leachate was assessed using standard indices: SAR, RSC, PI, Kelly’s Ratio, Percentage Sodium (%Na), PS, MH, and Chloride Absorption Index (CAI). The measured values for each parameter are presented in
Table 7.
The irrigation water quality of groundwater (BH1–BH5) and landfill leachate was assessed using standard indices: SAR, RSC, PI, Kelly’s Ratio, Percentage Sodium (%Na), PS, MH, and Chloride Absorption Index (CAI). The measured values for each parameter are presented in
Table 7.
Table 7: Irrigation WQI summary
| Index | BH1 | BH2 | BH3 | BH4 | BH5 | Leachate |
| SAR | 1.52 | 2.1 | 3.05 | 2.89 | 18.22 | 66.95 |
| RSC (meq/L) | -1497 | 320 | 275 | 310 | 540 | -1027 |
| PI | 4.34 | 78.9 | 82.4 | 80.1 | 32.1 | 5.75 |
| Kelly’s Ratio | 0.32 | 0.45 | 0.51 | 0.49 | 1.2 | 2.45 |
| %Na | 18.1 | 15.6 | 17.2 | 16.5 | 38.7 | 66.95 |
| PS (mg/L) | 250 | 190 | 210 | 220 | 250 | 850 |
| MH (%) | 46.8 | 38.2 | 41 | 39.5 | 52.3 | 61.4 |
| CAI | 0.66 | -0.12 | 0.08 | -0.05 | 1.85 | 3.2 |
The SAR values ranged from 1.52 to 66.95, with BH1–BH4 falling below 3.1, BH5 at 18.22, and the landfill leachate reaching 66.95, indicating an increasing sodium hazard closer to the landfill source. RSC values exhibited a wide range, from an extremely negative value of –1497 in BH1 to a high of 540 in BH5, with the leachate recording –1027. A negative RSC indicates that the Ca and Mg concentrations exceed the carbonate and bicarbonate levels, generally lowering the risk of carbonate precipitation and related sodicity problems. The PI was below 10% in BH1 and the leachate, suggesting poor water movement through the soil, but exceeded 78% in BH2–BH4, indicating favorable permeability. Kelly’s ratio surpassed 1.0 in BH5 and the leachate, reflecting unsafe sodium dominance, while it remained lower in BH1–BH4. %Na was highest in the leachate (66.95%) and BH5 (38.7%), both above the acceptable threshold for irrigation, whereas BH1–BH4 remained below 20%. PS was also highest in the leachate (850), followed by BH1 and BH5 (both 250), implying elevated Cl and SO₄²⁻ contents. MH exceeded 50% in BH5 and the leachate, indicating magnesium dominance that could impair the soil structure. CAI values were the highest in BH1, BH5, and the leachate, ranging from 0.66 to 3.2, suggesting significant chloride-related ion exchange that may further alter soil chemistry and water suitability.
Discussion
Physicochemical Parameters
Physicochemical characterization of groundwater and landfill leachate provides critical insights into the environmental impact of landfill operations on local water resources. In this study, parameters such as pH, color, turbidity, TDS, conductivity, ammonia, nitrate, NO₂⁻, sulfate, total organic carbon (TOC), and COD were analyzed to assess the degree of contamination and the potential risks to human and ecological health. The pH values of the groundwater samples ranged between 7.29 and 7.69, whereas the landfill leachate exhibited a marginally higher pH of 8.39. All pH values conformed to SANS 241 for drinking water, indicating a largely neutral to mildly alkaline aqueous environment. This slightly alkaline trend in borehole water is likely attributed to the inherent buffering capacity of the aquifer matrix, which can neutralize acidic inputs 15. Conversely, the elevated pH in landfill leachate reflects the alkaline conditions common in stabilized leachates, often resulting from the decomposition of organic matter, which releases ammonia and bicarbonates, as well as mineral dissolution processes within the landfill matrix 15. These conditions may enhance the mobilization of certain heavy metals through complexation, thereby influencing the contaminant transport dynamics.
Color and turbidity measurements revealed substantial degradation of water quality in boreholes proximal to the landfill, particularly in BH1 and BH2. The color values at BH1 reached 51 Pt-Co units, more than triple the SANS 241 recommended limit of 15 Pt-Co, indicating a pronounced presence of chromophoric dissolved organic matter (CDOM), Fe complexes, and potentially other leachate-derived contaminants 26. Elevated turbidity at BH1 (373 NTU) and BH2 (42.4 NTU) similarly exceeded the acceptable threshold of 5 NTU by a wide margin, suggesting high concentrations of suspended solids, microbial aggregates, and colloidal materials 26. Elevated turbidity compromises the aesthetic quality of water and facilitates the transport of pathogens and adsorbed pollutants, thereby increasing health risks. TDS and conductivity measurements further highlighted the severity of contamination in landfill leachate compared to that in groundwater. The leachate exhibited an extraordinarily high TDS concentration of 89,900 mg/L and conductivity of 1,661 mS/m, indicative of hypersaline conditions, surpassing typical freshwater thresholds by several orders of magnitude. This is consistent with the accumulation of inorganic salts, metals, and organic acids leached from decomposing refuse, which contribute to elevated ionic strengths and salinity 27. In contrast, groundwater samples recorded TDS values well below the drinking water limit of 1,200 mg/L, although boreholes nearer the landfill (BH2 and BH5) demonstrated relatively higher TDS concentrations (790 and 768 mg/L, respectively), indicating leachate intrusion and solute migration through subsurface pathways. The spatial gradients in TDS and conductivity reflect the interplay between landfill leachate percolation, aquifer geology, and hydrodynamics, which control contaminant dispersion.
N species analysis highlighted severe nitrogenous pollution emanating from landfills. NO₃⁻ levels in leachate peaked at 160 mg/L, dramatically exceeding the regulatory limit of 11 mg/L, and were consistent with active nitrification processes and organic matter degradation 27. While NO₃⁻ concentrations in most boreholes remained below this limit, BH1’s NO₃⁻ concentration of 24.8 mg/L was anomalously elevated, suggesting localized leachate impact or anthropogenic sources such as agricultural runoff or septic systems. NO₃⁻ concentrations were below detection in most groundwater samples but notably exceeded the limit at BH5 (2.1 mg/L), indicating active N cycling and transient accumulation of NO₃⁻, which can be more toxic than NO₃⁻ and serve as a red flag for recent or ongoing contamination 28. NH₃ concentrations in BH1 and BH2 were alarmingly high at 24.8 mg/L and 31 mg/L, respectively, exceeding the SANS 241 limit of 1.5 mg/L by more than an order of magnitude. NH₃ is a critical marker of organic waste decomposition and leachate contamination 5. Its persistence in groundwater can cause oxygen depletion and toxicity due to its conversion to ammonium ions, exacerbating ecological risks and reducing water portability 29. The exceptionally high ammonia concentration in the leachate (180 mg/L) confirms that the landfill is the primary contamination source. Interestingly, BH2, despite showing the highest microbial contamination, did not correspond with the highest TDS or heavy metal content, suggesting that its pollution signature is influenced more by recent microbial influx, possibly from surface runoff or compromised borehole integrity, rather than deep leachate migration. This nuance indicates the need for targeted hydrogeological investigations to differentiate between contamination sources.
TOC and COD concentrations mirrored the general pollution trend, with the landfill leachate showing TOC levels of 850 mg/L and COD of 2,600 mg/L, far exceeding typical background values. Elevated TOC reflects the abundance of dissolved organic compounds, many of which are biodegradable and can fuel microbial growth, whereas high COD levels indicate a substantial organic load requiring oxygen for degradation. The BOD/COD ratio of 0.6 across samples suggests moderately biodegradable organic matter, which is characteristic of landfill leachates in advanced stabilization stages. In summary, the physicochemical analysis decisively implicated landfill leachate as a significant source of groundwater contamination in the study area. Elevated color, turbidity, TDS, conductivity, and nitrogenous compounds near the landfill, particularly in BH1 and BH2, reflect leachate infiltration and highlight compromised water quality, with direct implications for public health and ecosystem sustainability. These findings highlight the urgent need for robust groundwater monitoring, improved landfill management practices, including lining and leachate treatment, and community education on water use to mitigate ongoing contamination risks.
HM Contamination
The findings indicate significant HM contamination in borehole water, posing major environmental and public health concerns. Notably high Cd levels, particularly in BH5, suggest strong contamination sources likely linked to landfill leachate infiltration or industrial runoff. This aligns with the known association of Cd with battery waste, pigments, and metal plating processes. Cd is highly toxic, and chronic ingestion has been linked to renal dysfunction, bone demineralization, and carcinogenic effects 29, 30. Pb concentrations far exceed regulatory thresholds, raising serious health concerns due to Pb’s potent neurotoxicity, especially in children. Elevated Pb levels in BH1 and BH2 likely resulted from a combination of landfill leachate percolation and corrosion of Pb-based plumbing materials. These observations are consistent with similar findings in landfill-contaminated sites, although the concentrations reported here are considerably higher 4, 31. Cr levels in boreholes and leachate also surpassed the permissible limits, indicating an industrial influence. Cr compounds, widely used in electroplating and paint production, are represented by an extremely high Cr concentration in leachate (8770 µg/L), indicating significant industrial input. Although speciation analysis was not performed, it is important to recognize that hexavalent Cr(VI) is much more toxic than trivalent Cr(III), with Cr(VI) classified as a human carcinogen 4, 30. Future studies should focus on Cr speciation to assess health risks more accurately.
Elevated Fe and Al concentrations, particularly in BH2, likely originated from metal-rich leachate infiltrating the aquifer. Although Fe is not considered highly toxic, it can negatively affect the aesthetic and organoleptic quality of water. Al exposure has been implicated in neurological effects, including possible links to Alzheimer’s disease 16. Hg and As, both of which are highly toxic and persistent in the environment, were detected above the permissible limits. The presence of Hg in BH1 may be traced to industrial activities or mining runoff, whereas elevated As levels in BH1 and BH5 suggest ongoing leachate contamination 5, 32. Statistical analyses support these concerns by showing high variability and skewness in parameters such as Cd and nitrate, which indicate localized contamination events. Elevated kurtosis values suggest frequent and extreme contamination episodes. These statistical patterns highlight the spatially uneven but severe impact of landfill leachate on groundwater quality. Although elevated Cr levels in leachate indicate industrial sources, this alone does not confirm illegal industrial waste dumping at the landfill, necessitating more detailed leachate profiling or waste audits 30. The results demonstrate severe and spatially variable heavy metal contamination in borehole water, especially in BH1, BH2, and BH5, which is strongly influenced by landfill leachate infiltration, with potential contributions from industrial waste and deteriorating infrastructure.
Microbial Contaminants
The presence of E. coli directly indicates fecal contamination, likely originating from landfill leachate infiltration containing human and animal waste 5. The higher E. coli concentration in BH2 suggests a more severe impact, possibly due to its closer proximity to the landfill or greater leachate seepage into the aquifer. The widespread presence of total coliform bacteria further confirms microbial contamination and signals the potential presence of harmful microorganisms, including viruses and protozoa, posing a serious public health risk 33. High total coliform levels in boreholes raise concerns about the increased risk of gastrointestinal infections and waterborne diseases among communities using untreated borehole water. The exceptionally high TPC in leachate reflects intense microbial activity related to the decomposition of organic waste, which can migrate into groundwater via subsurface infiltration 1. These results strongly suggest that microbial contaminants originate from landfill leachate infiltration, carrying waste-derived microbes into the aquifer, which is consistent with earlier studies linking elevated microbial loads to landfill leachate migration 34, 35. The detection of MDR E. coli strains highlights an escalating public health concern. The presence of antibiotic resistance in groundwater likely reflects environmental reservoirs of antimicrobial resistance near poorly managed landfills, where pharmaceuticals from human and veterinary sources mix with waste 36. This complicates the treatment of waterborne infections and increases the risk for affected populations. Although this study sampled only one season, it acknowledges the potential influence of rainfall and recharge dynamics on microbial contamination. Rain-induced leachate mobilization during wet periods can elevate microbial loads, but the consistently high microbial concentrations observed indicate a persistent contamination issue rather than episodic inputs. Future multi-seasonal studies are recommended to better understand the temporal fluctuations and microbial risk dynamics.
LPI
The LPI value of 31.19 obtained in this study confirms that the Roundhill landfill leachate possesses a significant pollution load, with the potential to adversely affect the surrounding groundwater and surface water systems. This value is comparable to those reported for active landfills in other developing regions such as India (29.45–35.2), Bangladesh (30.5–34.8), and Nigeria (28.3–33.9) 3, 13, 37, 38. However, it exceeds the typical LPI values reported in South Africa, which often range between 20 and 28 18, 39, suggesting that the Roundhill landfill may be entering a more advanced phase of leachate maturation or is receiving diverse and potentially hazardous waste streams.
The high TDS concentration observed (89,900 mg/L) is particularly concerning, as it reflects the elevated ionic strength and salinity in the leachate. This is consistent with the findings of Maliki et al.40 and Ambujan & Thalla 41, who associated high TDS with significant deterioration of groundwater quality and salinization of aquifers. Organic pollutants, represented by elevated COD and BOD₅ values, indicate the ongoing anaerobic degradation of organic waste. Their substantial contributions to the LPI (3.22 and 1.95, respectively) underscore the presence of both biodegradable and refractory organic matter, which are typical features of aging landfills 13. HMs such as Cr, Pd, and Hg are key contributors to the overall pollution load because of their toxicity and environmental persistence. The concentrations of Cr (8.77 mg/L) and Pb (5.891 mg/L) were well above the typical background levels, indicating significant contamination that could be linked to inputs from electronic waste, discarded batteries, and industrial residues. The substantial LPI contributions of Cr (4.16) and Pb (3.47) were consistent with similar studies that emphasized the critical role of HMs in landfill risk profiling 37. Although Hg was detected at a lower concentration (0.487 mg/L), its high toxicity weight resulted in a significant index contribution (3.41), highlighting its risk even at trace levels.
Microbial contamination, as indicated by the total coliform count, also contributed to the LPI, with a value of 1.92. This supports the conclusion that landfill leachate carries a microbial load that is potentially derived from fecal matter and decaying organic waste. The presence of coliform bacteria signals an increased risk of waterborne diseases, particularly if leachate migrates into drinking water aquifers 33. Taken together, the LPI of 31.19 illustrates the multifaceted nature of pollution from the Roundhill landfill. The combination of high salinity, oxygen-demanding substances, heavy metals (HMs), and microbial pathogens presents a complex contamination profile. This emphasizes the urgent need for improved leachate containment, treatment infrastructure, and long-term monitoring strategies to protect nearby groundwater resources from their progressive deterioration.
Water Quality Index (WQI)
The high WQI values across all boreholes confirmed the presence of widespread groundwater contamination, rendering the sampled water unsafe for direct human consumption without treatment. The worst-affected sites, BH2 and BH1, exhibited WQI values exceeding 1000—well beyond the critical limit—driven by excessive concentrations of Fe, Mn, Ca, and microbial pathogens. These elevated levels are indicative of severe leachate infiltration from the nearby landfill, consistent with the findings of Kumar et al.42, who emphasized the sensitivity of the WQI to landfill-induced contamination in semi-urban groundwater systems. The presence of total coliforms and E. coli in all boreholes is especially concerning, suggesting that fecal contamination pathways are likely exacerbated by leachate percolation. This aligns with global studies, such as 43 in Egypt and 44 in Turkey, which observed similarly degraded WQI values due to the impact of nearby landfills and informal waste disposal.
Although BH4 had a WQI below 300, the detection of coliforms and E. coli still suggests a compromised safety. Its relatively lower levels of Fs and TDS suggest a lower degree of geochemical and anthropogenic influence, possibly due to hydrogeological variations such as aquifer depth or flow direction, as also reported by Singh et al.45 in studies of aquifer vulnerability near waste sites in India. Fe and TDS were the most dominant pollutants across the samples, reflecting both natural geochemical weathering and anthropogenic inputs from landfills. Excessive Fe in groundwater can lead to taste, staining, and health issues when consumed over long periods, particularly in vulnerable populations. Elevated TDS levels indicate increasing salinity, which can adversely affect soil and crop productivity if the water is used for irrigation 46. Although the WQI provides an effective composite metric for general water quality assessment, it lacks the granularity to identify specific toxicological risks. This limitation has been noted in studies by Medeiros et al.46 in Amazonian waters and Jahin et al.43, who advocated for complementary parameter-specific evaluations to better inform public health and remediation.
Advanced treatment technologies, such as reverse osmosis (RO) and activated carbon filtration, offer promising solutions to mitigate these risks. Medeiros et al.46 demonstrated the effectiveness of such technologies in removing heavy metals and reducing microbial and TDS loads to within safe drinking-water standards. These methods could be particularly viable for BH3, BH4, and BH5, where contaminant concentrations are comparatively lower, offering a practical remediation pathway with lower cost implications. In conclusion, the WQI values in this study reflect the combined impact of geochemical processes and anthropogenic activities, notably landfill leachate infiltration, on groundwater quality. These findings emphasize the urgent need for integrated monitoring, targeted treatment interventions, and stricter landfill management to prevent further groundwater degradation in vulnerable semi-arid regions.
Irrigation Water Quality Assessment
The results indicated significant spatial variability in irrigation water quality, with marked deterioration in the boreholes closest to the landfill, particularly BH1 and BH5. The SAR values suggest that BH1 to BH4 pose minimal sodium hazard to the soil structure. However, SAR values of 18.22 in BH5 and 66.95 in the landfill leachate greatly exceeded the safe irrigation threshold. Such elevated sodium concentrations can displace Ca and Mg from soil particles, reducing permeability and increasing the risk of waterlogging and sodic soil development 38. RSC values showed extremely negative values in BH1 and leachate, indicating a high presence of Ca and Mg. While a negative RSC typically implies a reduced risk of carbonate precipitation, unusually large magnitudes may reflect a strong chemical imbalance, potentially linked to landfill leachate infiltration. In contrast, BH2–BH5 exhibited moderately positive RSC values, indicating a relatively better chemical equilibrium for irrigation use 47.
The PI further supported these findings. Very low PI values in BH1 (4.34%) and landfill leachate (5.75%) suggest impaired soil permeability in these areas. In contrast, the high PI values in BH2–BH4 indicate favorable water movement through the soil, supporting their suitability for irrigation. Indicators related to sodium concentration—Kelly’s Ratio and %Na—also affirmed the degradation of water quality in BH5 and the leachate. Kelly’s Ratio values above 1.0 in these sources signal unsafe levels of sodium relative to Ca and Mg. Elevated %Na values (66.95% in leachate and 38.7% in BH5) exceeded the acceptable limits, raising concerns about soil structural damage and increased osmotic stress for crops 21. PS, which represents the combined Cl and SO₄²⁻ concentrations, was the highest in leachate (850) and BH5 (250), suggesting a high salt load that may accumulate in soils over time, limiting plant growth and water uptake. MH values above 50% in BH5 and the leachate revealed a dominance of Mg, which can adversely affect soil aggregation and reduce hydraulic conductivity. These values are consistent with the SAR and PI results reported by Malakar et al.23. The CAI further indicated potential leachate intrusion. CAI values were markedly positive in BH1, BH5, and the leachate, reflecting ion exchange processes that may alter groundwater chemistry and exacerbate salinization risks. In conclusion, BH2–BH4 appears to be relatively suitable for irrigation, although continued monitoring is essential to detect any progressive contamination. In contrast, BH1 and BH5 exhibited strong indications of pollution from landfill leachate, as evidenced by high SAR, PS, and CAI values, and low PI values. Landfill leachate is unsuitable for irrigation.
Correlation Analysis and Potential Sources
A comprehensive statistical analysis was conducted to evaluate the relationships between various water quality parameters in groundwater and landfill leachate. Given the non-parametric nature of the dataset and the presence of potential outliers, Spearman’s rank correlation coefficient was used to identify significant associations among contaminants, following the approach used by Mugudamani et al.25. Additionally, Pearson’s correlation analysis was performed on selected borehole samples to further investigate the inter-elemental relationships among HMs, a method that has been successfully applied in previous studies 25. To complement these analyses, PCA was employed to reduce data dimensionality and identify major pollution sources, similar to the methodologies described by Singh et al.45. The KMO measure of sampling adequacy and Bartlett’s test of sphericity were applied to confirm the suitability of the PCA for this dataset 25. Correlation analysis revealed strong positive relationships among key parameters, indicating shared contamination pathways. A high correlation was observed between TDS, conductivity, and color, with correlation coefficients of 0.96 (TDS and conductivity) and 0.78 (color and conductivity). These strong associations suggest that as one parameter increases, so do the others, reinforcing the hypothesis that landfill leachate infiltration is a primary pollution source, consistent with the findings of 45. Similarly, strong inter-elemental correlations among heavy metals, particularly Al, Cd, Cr, and Fe (ranging from 0.70 to 0.90), support the hypothesis that these metals originate from a common source, most likely landfill leachate and industrial waste disposal. This aligns with the findings of Gani et al.48, who reported similar clustering of heavy metals in groundwater impacted by waste leachate.
To further assess microbial contamination patterns, correlation analyses were conducted between Escherichia coli, total coliforms, and chemical parameters. The results revealed a strong positive correlation between E. coli and total coliforms (0.94), suggesting a common source of microbial contamination in the water sources. Additionally, microbial counts exhibited significant correlations with metals such as Al and Cd, reinforcing the hypothesis that landfill leachate is responsible for both microbial and heavy metal contamination. Interestingly, pH displayed weak or negative correlations with most contaminants, indicating that variations in pH do not significantly influence pollutant concentrations in the study area, a finding consistent with previous studies on landfill leachate contamination 45. To further elucidate the contamination sources, PCA was applied to the transformed data matrix, and the KMO measure (0.625, p < 0.01) and Bartlett’s test of sphericity confirmed its suitability. Two principal components (PCs) with eigenvalues > 1 were identified, explaining 97.99% of the total variance in the borehole water samples. PC1 accounted for 74.06% of the variance and was strongly associated with Fe, Cd, Zn, and Cr, suggesting an anthropogenic origin related to industrial effluents, domestic waste, vehicular emissions, and municipal sewage, as reported by Gani et al.48. Notably, Pb exhibited a negative loading
(-0.597), indicating a distinct pollution source, possibly linked to corrosion from underground plumbing or legacy contamination from past industrial activities, similar to the observations
of 49.
Overall, the results of Spearman’s and Pearson’s correlations and PCA collectively highlighted landfill leachate as a major contributor to the dispersion of heavy metals and microbial contaminants in the study area. The strong correlations and component groupings suggest that groundwater contamination is primarily driven by leachate infiltration. Figure 2 presents a Spearman correlation heatmap of the water quality parameters across the boreholes. Strong positive correlations (red) indicate shared contamination pathways, particularly among HMs (Al, Cd, Cr, and Fe) and physicochemical indicators (TDS and conductivity), supporting the hypothesis that landfill leachate infiltration is the primary pollution source.
Figure 2: Spearman correlation heatmap of groundwater quality parameters across boreholes BH1–BH5 near the Roundhill Landfill Site.
Figure 3 shows the PCA biplot of groundwater quality parameters near the Roundhill landfill site. The blue points represent the borehole samples (BH1–BH5), and the red vectors show the directional influence of the key contaminants. BH1 and BH2 clustered near the vectors for HMs (Fe, Cd, Cr, Zn) and microbial indicators (E. coli, total coliforms), indicating a strong leachate influence. In contrast, BH4 and BH5 were located away from these vectors, suggesting comparatively lower contamination levels.
Figure 3: PCA biplot of groundwater quality parameters across boreholes BH1–BH5 near the Roundhill Landfill Site.
Human Health Risk Assessment of the Borehole Samples
A HHRA was conducted to evaluate the potential adverse health effects associated with exposure to HMs and microbial contaminants in borehole water. The assessment followed the U.S. EPA risk assessment framework, considering both non-carcinogenic HQ and carcinogenic LCR risks for adults and children through oral ingestion, which is the primary pathway of exposure. The calculated HQ and LCR values were compared with acceptable limits to determine potential health hazards.
Non-Carcinogenic Risk Assessment
The non-carcinogenic risk assessment evaluated the potential chronic health effects associated with exposure to HMs in borehole water using the HQ Eq. (13). An HQ value exceeding 1 indicates a significant non-carcinogenic health risk, whereas values below 1 suggest no immediate health hazard. The findings revealed that Cd, Pb, and Cr(VI) exhibited the highest HQ values, significantly exceeding the acceptable limit and posing severe health risks to both adults and children. Cd levels in BH1 and BH5 resulted in HQ values of 3.67 for adults and 5.21 for children, suggesting a high probability of renal dysfunction, skeletal demineralization, and cardiovascular complications due to prolonged exposure 50. Similarly, Pb exposure posed critical neurological risks, with HQ values of 4.89 in adults and 7.15 in children, indicating a high likelihood of cognitive impairment, brain damage, and developmental disorders in children 51. Additionally, Cr VI contamination emerged as a high-risk factor, with HQ values of 3.45 in adults and 5.89 in children, reinforcing concerns over liver toxicity, respiratory distress, and immune suppression associated with long-term ingestion.
Moderate risks were observed for Al and Hg, with HQ values ranging from 1.24 to 2.76, suggesting potential neurotoxicity, metabolic disturbances, and long-term cognitive risks if exposure continues. Although Fe and Zn were detected at elevated concentrations, their HQ values remained below 1, indicating no immediate toxicity concerns but a potential for gastrointestinal discomfort with excessive intake. These findings highlight the urgent need for intervention measures, particularly for boreholes BH1 and BH5, where high HQ values indicate an increased likelihood of chronic health effects, necessitating immediate water treatment and monitoring strategies to mitigate the public health risks. Table 8 provides a summary of the HQ values for the key contaminants. Risk classification was based on standard HQ thresholds as follows:
- Low Risk: HQ < 1
- Moderate Risk: HQ between 1 and 3
- High Risk: HQ > 3. These ranges follow the guidelines outlined by the U.S. Environmental Protection Agency was used to interpret the non-carcinogenic health risks associated with long-term exposure to contaminants through the ingestion of borehole water.
Although this study applied the standard U.S. EPA default exposure parameters, a limited sensitivity analysis was conducted by adjusting body weight and ingestion rates to reflect local demographic variability. The HQ values remained above the risk threshold for all tested exposure scenarios, particularly for children, confirming the robustness of the risk estimates. Given the magnitude of risk, especially the HQ values for Cd, Pb, and Cr(VI) exceeding 5.0 in children, the use of borehole water from BH1, BH2, and BH5 should be immediately restricted for drinking. Interim policy measures, such as the provision of alternative water sources, point-of-use treatment systems (e.g., reverse osmosis), and continuous monitoring, are urgently recommended. Additionally, authorities should implement landfill containment upgrades and restrict further leachate migration to prevent long-term public health impacts.
Table 8: Non-carcinogenic risk assessment (HQ values) for borehole water contaminants
| Contaminant | HQ (adults) |
HQ (children) |
Risk classification |
Potential source |
| Aluminum (Al) | 1.24 | 2.76 | Moderate | Landfill leachate, industrial discharge |
| Cadmium (Cd) | 3.67 | 5.21 | High | Landfill leachate, industrial waste |
| Chromium (Cr VI) | 3.45 | 5.89 | High | Landfill leachate, industrial waste, plumbing corrosion |
| Iron (Fe) | 0.89 | 1.02 | Low | Naturally occurring, landfill leachate |
| Lead (Pb) | 4.89 | 7.15 | High | Landfill leachate, industrial discharge |
| Mercury (Hg) | 1.62 | 2.45 | Moderate | Landfill leachate, mining activities |
| Zinc (Zn) | 0.76 | 0.91 | Low | Naturally occurring, industrial processes |
| E. coli | 5.21 | 7.83 | High | Faecal contamination from landfill leachate |
| Total Coliforms | 4.76 | 6.91 | High | Faecal contamination from landfill leachate |
Risk Classification Ranges: Low: HQ < 1.0, Moderate: HQ ≥ 1.0 and ≤ 3.0, High: HQ > 3.0
Carcinogenic risk assessment
The LCR was calculated using the following equation: (14) to assess the long-term probability of developing cancer due to exposure to carcinogenic HMs in borehole water. According to U.S. EPA guidelines, an LCR exceeding 1 × 10 ⁴ is considered a very high cancer risk, while values below 1 × 10 ⁶ are deemed negligible. The findings indicated that Cr(VI) and Pb posed the highest carcinogenic risks, with LCR values of 5.2 × 10-³ for adults and 8.7 × 10-³ for children, significantly exceeding the EPA’s upper permissible limit. These values suggest an alarming cancer risk for long-term consumers of untreated borehole water, particularly in BH1 and BH5, where the contamination was most severe. Chronic ingestion of Cr(VI) has been directly linked to lung, liver, and gastrointestinal cancers, whereas Pb exposure is known to contribute to carcinogenic and neurological effects, particularly in children, owing to its ability to cross the blood-brain barrier 51. Cd contamination also presented a significant cancer risk, with LCR values of 3.9 × 10-³ in adults and 6.2 × 10-³ in children, reinforcing its classification as a Group 1 carcinogen with established links to lung, prostate, and kidney cancer 52. Additionally, arsenic (As) was detected at elevated concentrations in BH1 and BH5, contributing to LCR values exceeding 1 × 10-³, highlighting its potential to induce skin, lung, and bladder cancer upon prolonged exposure. The high LCR values in children are particularly concerning, as their higher water intake per body weight and developing physiology make them more vulnerable to toxic metal exposure. These findings suggest that consuming untreated borehole water in the study area substantially increases cancer risk, highlighting the urgent need for remedial measures, including groundwater treatment, alternative water sources, and stricter waste management protocols, to mitigate public health threats. Table 9 presents the LCR values for adults and children, comparing them with the EPA’s permissible limits to contextualize the severity of cancer risk exposure.
The LCR was calculated using the following equation: (14) to assess the long-term probability of developing cancer due to exposure to carcinogenic HMs in borehole water. According to U.S. EPA guidelines, an LCR exceeding 1 × 10 ⁴ is considered a very high cancer risk, while values below 1 × 10 ⁶ are deemed negligible. The findings indicated that Cr(VI) and Pb posed the highest carcinogenic risks, with LCR values of 5.2 × 10-³ for adults and 8.7 × 10-³ for children, significantly exceeding the EPA’s upper permissible limit. These values suggest an alarming cancer risk for long-term consumers of untreated borehole water, particularly in BH1 and BH5, where the contamination was most severe. Chronic ingestion of Cr(VI) has been directly linked to lung, liver, and gastrointestinal cancers, whereas Pb exposure is known to contribute to carcinogenic and neurological effects, particularly in children, owing to its ability to cross the blood-brain barrier 51. Cd contamination also presented a significant cancer risk, with LCR values of 3.9 × 10-³ in adults and 6.2 × 10-³ in children, reinforcing its classification as a Group 1 carcinogen with established links to lung, prostate, and kidney cancer 52. Additionally, arsenic (As) was detected at elevated concentrations in BH1 and BH5, contributing to LCR values exceeding 1 × 10-³, highlighting its potential to induce skin, lung, and bladder cancer upon prolonged exposure. The high LCR values in children are particularly concerning, as their higher water intake per body weight and developing physiology make them more vulnerable to toxic metal exposure. These findings suggest that consuming untreated borehole water in the study area substantially increases cancer risk, highlighting the urgent need for remedial measures, including groundwater treatment, alternative water sources, and stricter waste management protocols, to mitigate public health threats. Table 9 presents the LCR values for adults and children, comparing them with the EPA’s permissible limits to contextualize the severity of cancer risk exposure.
Table 9: Carcinogenic risk assessment (LCR values) for borehole water contaminants
| Contaminant | LCR (adults) |
LCR (children) |
EPA acceptable limit (1 × 10⁻4) |
Risk classification |
| Cadmium (Cd) | 3.9 × 10⁻³ | 6.2 × 10⁻³ | 1 × 10⁻4 | Very high |
| Chromium (Cr VI) | 5.2 × 10⁻³ | 8.7 × 10⁻³ | 1 × 10⁻4 | Very high |
| Lead (Pb) | 4.6 × 10⁻³ | 7.4 × 10⁻³ | 1 × 10⁻4 | Very high |
| Arsenic (As) | 1.3 × 10⁻³ | 2.1 × 10⁻³ | 1 × 10⁻4 | Very high |
Risk classification: < 1 × 10⁻4 - Negligible, 1 × 10⁻4 – 1 × 10⁻4 - Acceptable, 1 × 10⁻4 – 1 × 10⁻³ - High, > 1 × 10⁻³ - Very High. Note: 1 × 10⁻4represents the upper limit of the acceptable risk range according to the US EPA. Values exceeding this were classified as high or very high risk.
The HHRA confirmed that borehole water in the study area is unsafe for human consumption without treatment, posing severe non-carcinogenic and carcinogenic health risks, particularly for children. The elevated levels of Cd, Cr(VI), Pb, and microbial pathogens necessitate urgent intervention measures, including advanced water treatment, regular groundwater monitoring, and public health awareness campaigns. Without immediate action, prolonged exposure can lead to chronic illnesses, developmental disorders, and increased cancer risks, reinforcing the need for strict regulatory enforcement and sustainable waste management to protect public health.
Conclusions
This study provides a comprehensive evaluation of groundwater contamination resulting from landfill leachate intrusion and its associated health and environmental risks. The findings revealed severe contamination of borehole water, with HMs and microbial pollutants exceeding the recommended safety thresholds. The boreholes closest to the landfill exhibited elevated concentrations of Cd, Pb, Cr, Fe, and Hg, reinforcing the role of leachate percolation as the primary pollution source. These contaminants pose significant health risks, particularly to children and immunocomromised individuals, increasing the likelihood of renal dysfunction, neurological disorders, developmental impairment, and potential carcinogenic effects.
Statistical analyses, including Pearson’s correlation and PCA, further confirmed the strong association between heavy metal contamination and microbial pollution, indicating a shared pollution origin from landfill leachate. The highly positive correlations among TDS, conductivity, HMs, and microbial contaminants highlight the systemic nature of groundwater degradation in this study area. The WQI values exceeded the acceptable limits across all boreholes, confirming that the water is unfit for human consumption without treatment. Similarly, the IWQI showed that while some boreholes were marginally suitable for irrigation, BH5 and the landfill leachate posed severe risks due to excessive sodium adsorption and magnesium content, which can degrade soil quality and reduce its permeability.
HHRA revealed that the concentrations of Cd, Pb, and Cr exceeded both the non-carcinogenic and carcinogenic risk thresholds, with children facing disproportionately higher HQ and LCR values. The detection of E. coli and Total Coliforms at alarming levels further indicates widespread microbial contamination, raising the risk of waterborne diseases such as gastroenteritis, cholera, and dysentery. In light of these findings, the following targeted interventions are urgently recommended.
- Regulatory action: Enforcing municipal and provincial regulations mandating groundwater quality monitoring around landfill zones and updated policy thresholds for HMs and microbial pollutants.
- Leachate control: Strengthening landfill engineering standards through the installation of impermeable liners, leachate drainage systems, and proper capping of waste cells to minimize vertical and lateral contaminant migration.
- Water treatment: Deploying point-of-use and community-scale water treatment technologies, such as reverse osmosis, activated carbon filtration, or UV disinfection, particularly for boreholes BH1, BH2, and BH5.
- Alternative water supply: Exploring the provision of safe alternative water sources (e.g., municipal piped water and rainwater harvesting) for severely affected communities until water quality improves.
- Community health surveillance: Establishing early warning health monitoring programs and public education campaigns on water safety, particularly for vulnerable groups.
These measures are essential for protecting public health and ensuring the long-term sustainability of groundwater resources in Berlin, Eastern Cape, South Africa, particularly for communities relying on borehole water near the Roundhill Landfill site.
Recommendations and Future Directions
1. Water Treatment and Alternative Supply
Immediate intervention is required to ensure access to safe drinking water for the affected communities. The implementation of advanced filtration systems, reverse osmosis, and chemical treatment methods is essential for the effective removal of HMs and microbial contaminants from water. In parallel, the provision of alternative drinking water sources, such as municipal supply expansions, rainwater harvesting, and groundwater abstraction from uncontaminated sites, should be prioritized to reduce public exposure to unsafe borehole water.
2. Groundwater Monitoring and Regulatory Compliance
Regular and systematic groundwater quality monitoring must be mandated to track contamination trends, detect emerging pollutants, and enforce compliance with the SANS 241 and WHO drinking water quality guidelines. A longitudinal monitoring program covering multiple seasons should be implemented to assess temporal fluctuations in contaminant levels, particularly in relation to rainfall, aquifer recharge, and leachate migration dynamics. Real-time monitoring systems and early warning mechanisms should be introduced to promptly detect water quality deterioration. Government agencies should strengthen regulatory frameworks and enforcement mechanisms to hold landfill operators accountable for pollution control and remediation efforts.
3. Landfill Leachate Management and Remediation
Strengthening leachate containment strategies, including engineered liners, leachate collection systems, and waste segregation measures, is crucial to prevent further groundwater contamination. Advanced bioremediation techniques, such as microbial consortia applications and phytoremediation, should be explored for the natural degradation of pollutants in groundwater. Additionally, chemical precipitation, ion exchange, and adsorption using activated carbon should be implemented to reduce HM concentrations, while advanced oxidation processes (AOPs) can degrade persistent organic contaminants, thereby lowering the BOD and COD in leachate.
4. Public Awareness and Health Risk Mitigation
Community engagement and health education programs should be initiated to inform local populations about the dangers of consuming untreated borehole water and promote boiling, filtration, and chlorination techniques for home water treatment. Special attention should be paid to vulnerable groups, including children, pregnant women, and the elderly, who are more susceptible to the adverse health effects of heavy metals and microbial contamination. Additionally, public-private partnerships should be encouraged to improve water infrastructure and sanitation in the affected areas.
5. Further Research and Policy Development
Future studies should focus on long-term groundwater quality assessments by incorporating hydro-geochemical modelling, pollution source tracking, and risk-based assessments to forecast contamination spread and evaluate the effectiveness of remediation interventions. Seasonal comparative studies should be conducted to determine whether contaminant concentrations fluctuate with climatic cycles and surface runoff. Additionally, policies should be revised to enforce stricter landfill management regulations, incorporating eco-friendly waste disposal methods, such as waste-to-energy technologies, sustainable landfill capping, and circular economy approaches, to minimize environmental impact.
Ethics approval and consent to participate
The plant management agreed to use their facilities, provided that its location and identity were not disclosed.
Consent for publication
The manuscript does not contain any individual person’s data in any form (for example, individual details, images, or videos).
Availability of data and material
The data supporting the findings of this study are available upon request.
Acknowledgements
The authors sincerely appreciate the University of South Africa for providing the necessary technical support and research infrastructure for this study. Special thanks are extended to the landfill personnel for their invaluable assistance during the sampling process and to the Capricorn District Municipality for their cooperation and logistical support of this study. The authors also acknowledge all individuals and institutions that contributed to the successful completion of this study.
Conflict of Interest
The authors declare no conflicts of interest.
Funding
This research did not receive any specific grants from funding agencies in the public, commercial, or not-for-profit organizations.
Ethical Considerations
This study did not involve human or animal subject. All fieldwork, sample collection, and data analyses were conducted responsibly and with minimal environmental disturbance, adhering to the principles of scientific integrity.
Code of Ethics
This study followed the institutional code of ethics and professional standards for environmental research. Data handling, reporting, and interpretation were conducted with transparency, honesty, and rigor.
Authors' Contributions
Timoti Silwani was involved in conceptualization, methodology, data collection, and formal analysis; Nomathemba Themba did the writing of the initial draft, data validation, review and editing, visualization, and interpretation of results; Tlou B. Chokwe conducted methodology, writing—review and editing, statistical analysis, and data curation; Khomotso Semenya carried out supervision and project administration.
This is an Open-Access article distributed in accordance with the terms of the Creative Commons Attribution (CC BY 4.0) license, which permits others to distribute, remix, adapt, and build upon this work for commercial use.
References
- Owojori OM, Mulaudzi R, Edokpayi JN. Student’s knowledge, attitude, and perception (KAP) to solid waste management: a survey towards a more circular economy from a rural-based tertiary institution in South Africa. Sustainability. 2022; 14(3):1310.
- Boateng TK, Opoku F, Akoto O. Heavy metal contamination assessment of groundwater quality: a case study of Oti landfill site, Kumasi. Appl Water Sci.2019; 9(2): 33.
- Moloi M, Ogbeide O, Otomo PV. Probabilistic health risk assessment of heavy metals at wastewater discharge points within the Vaal River Basin, South Africa. Int J Hyg Environ Health.2020; 224, 113421.
- Chollom MN, Adeyinka GC, Bakare BF. Investigating the current trend of selected heavy metal pollution with possible ecological and human health effects along the uMgeni River of KwaZulu-Natal, South Africa. Int J Environ Anal Chem. 2024; 104(20):9509-2.
- Li P, Lai Y, Li Q, et al. Total organic carbon as a quantitative index of micro-and nano-plastic pollution. Analytical chemistry. 2022; 94(2): 740-7.
- Sadeghi H, Fazlzadeh M, Zarei A, et al. Spatial distribution and contamination of heavy metals in surface water, groundwater and topsoil surrounding Moghan’s tannery site in Ardabil, Iran. Int J Environ Anal Chem. 2022; 102(5): 1049-59.
- Szulc J, Okrasa M, Nowak A, et al. Assessment of physicochemical, microbiological and toxicological hazards at an Illegal landfill in Central Poland. Int J Environ Res Public Health. 2022; 19(8):4826.
- Adimalla N, Qian H, Wang H. Assessment of heavy metal (HM) contamination in agricultural soil lands in northern Telangana, India: an approach of spatial distribution and multivariate statistical analysis. Environ Monit Assess. 2019; 191: 1-15.
- He X, Li P. Surface water pollution in the middle Chinese Loess Plateau with special focus on hexavalent chromium (Cr6+): occurrence, sources and health risks. Expo Health.2020; 12(3): 385-401.
- Iloms E, Ololade OO, Ogola HJ, et al. Investigating industrial effluent impact on municipal wastewater treatment plant in Vaal, South Africa. Int J Environ Res Public Health. 2020; 17(3): 1096.
- Wagh VM, Panaskar DB, Mukate SV, et al. Health risk assessment of heavy metal contamination in groundwater of Kadava River Basin, Nashik, India. Model Earth Syst Environ 2018; 4: 969–80.
- Touzani A, El Hammoudani Y, Dimane F, et al. Characterization of leachate and assessment of the leachate pollution index-a study of the controlled landfill in fez. Ecological Engineering & Environmental Technology. 2024; 25(4).
- Parvin F, Tareq SM. Impact of landfill leachate contamination on surface and groundwater of Bangladesh: a systematic review and possible public health risks assessment. Appl Water Sci. 2021; 11(6): 100.
- Lee KS, Ko KS, Kim EY. Application of stable isotopes and dissolved ions for monitoring landfill leachate contamination. Environ Geochem Health.2020; 42: 1387-99.
- Özçoban MŞ, Acarer S, Tüfekci N. Effect of solid waste landfill leachate contaminants on hydraulic conductivity of landfill liners. Water Science and Technology. 2022; 85(5): 1581-99.
- Qian Y, Hu P, Lang-Yona N, et al. Global landfill leachate characteristics: occurrences and abundances of environmental contaminants and the microbiome. J Hazard Mater. 2024; 461: 132446.
- Kumari S, Singh AK, Verma AK, et al. Assessment and spatial distribution of groundwater quality in industrial areas of Ghaziabad, India. Environ Monit Assess.2014; 186: 501-14.
- Mepaiyeda S, Madi K, Gwavava O, et al. Geological and geophysical assessment of groundwater contamination at the Roundhill landfill site, Berlin, Eastern Cape, South Africa. Heliyon. 2020; 6(7).
- South Africa. Department of Water Affairs and Forestry Bredenhann L. Minimum requirements for waste disposal by landfill .The Department; 1998.
- Mohan SV, Nithila P, Reddy SJ. Estimation of heavy metals in drinking water and development of heavy metal pollution index. Journal of Environmental Science & Health Part A. 1996; 31(2):283–9.
- Abbasnia A, Radfard M, Mahvi AH, et al. Groundwater quality assessment for irrigation purposes based on irrigation water quality index and its zoning with GIS in the villages of Chabahar, Sistan and Baluchistan, Iran. Data Brief. 2018; 19: 623-31.
- Zaman M, Shahid SA, Heng L. Guideline for salinity assessment, mitigation and adaptation using nuclear and related techniques. Springer Nature; 2018.
- Malakar A, Snow DD, Ray C. Irrigation water quality—A contemporary perspective. Water. 2019; 11(7): 1482.
- United States. Environmental Protection Agency. Office of Emergency, Remedial Response. Risk assessment guidance for superfund. Office of Emergency and Remedial Response, US Environmental Protection Agency; 1989.
- Mugudamani I, Oke SA, Gumede TP, et al. Herbicides in water sources: communicating potential risks to the population of Mangaung Metropolitan Municipality, South Africa. Toxics. 2023; 11(6): 538.
- Helard D, Indah S, Wilandari M. Spatial variation of electrical conductivity, total suspended solids, and total dissolved solids in the Batang Arau River, West Sumatera, Indonesia. InIOP Conference Series: Materials Science and Engineering 2021. IOP Publishing; 2021. p. 012027.
- Akpan Emmanuel F, Akpan Veronica M, Inyang Udeme U. Geoelectrical investigation of groundwater quality through estimates of total dissolved solids and electrical conductivity in parts of Akwa Ibom state, southern Nigeria. Malaysian Journal of Geosciences. 2020; 4(1): 32-7.
- Giwa SO, Sharifpur M, Meyer JP, et al. Experimental measurement of viscosity and electrical conductivity of water-based γ-Al2O3/MWCNT hybrid nanofluids with various particle mass ratios. J Therm Anal Calorim.2021; 143: 1037-50.
- Mutileni N, Mudau M, Edokpayi JN. Water quality, geochemistry and human health risk of groundwater in the Vyeboom region, Limpopo province, South Africa. Sci Rep.2023; 13(1): 19071.
- Githaiga KB, Njuguna SM, Gituru RW, et al. Water quality assessment, multivariate analysis and human health risks of heavy metals in eight major lakes in Kenya. J Environ Manage. 2021; 297: 113410.
- Nkwenkwezi MG. Applications of Statistical Techniques on the Assessment of Water Quality Parameters. University of Johannesburg (South Africa); 2021.
- Huang Z, Liu G, Zhang Y, et al. Assessing the impacts and contamination potentials of landfill leachate on adjacent groundwater systems. Sci Total Environ. 2024; 930: 172664.
- Baettker EC, Kozak C, Knapik HG, et al. Applicability of conventional and non-conventional parameters for municipal landfill leachate characterization. Chemosphere. 2020; 251: 126414.
- Mutileni N. Assessment of health risk association with groundwater from Collins Chabane and Makhado Municipality of Vhembe District; 2021.
- Shaku KN. Assessment of bacteriological quality of water in boreholes from 2016 to 2020, in Gert Sibande District Municipality, Mpumalanga, South Africa. University of Johannesburg (South Africa); 2022.
- Shen W, Zhang H, Li X, et al. Pathogens and antibiotic resistance genes during the landfill leachate treatment process: occurrence, fate, and impact on groundwater. Sci Total Environ. 2023; 903: 165925.
- Chaudhary R, Nain P, Kumar A. Temporal variation of leachate pollution index of Indian landfill sites and associated human health risk Environmental Science and Pollution Research. 2021; 28: 28391-406.
- Abunama T, Moodley T, Abualqumboz M, et al. Variability of leachate quality and polluting potentials in light of leachate pollution index (LPI)–a global perspective. Chemosphere. 2021; 282: 131119.
- Ruzvidzo S, Oke S. Assessing the Drinking Water Quality Indexes of Borehole and Surface Water Close to a Mining Dump in Welkom, South Africa. InInternational Symposium on Water Resource and Environmental Management 2023 Dec 8 Cham: Springer Nature Switzerland; 2023. p.1-11.
- Maliki AA, Chabuk A, Sultan MA, et al. Estimation of total dissolved solids in water bodies by spectral indices case study: Shatt al-Arab River. Water Air Soil Pollut. 2020; 231: 1-11.
- Ambujan A, Thalla AK. An approach to quantify the contamination potential of hazardous waste landfill leachate using the leachate pollution index. Int J Environ Sci Technol (Tehran). 2024; 21(1): 957-68.
- Kumar V, Sharma A, Kumar R, et al. Assessment of heavy-metal pollution in three different Indian water bodies by combination of multivariate analysis and water pollution indices. Human And Ecological Risk Assessment: An International Journal .2020; 26(1): 1-16.
- Jahin HS, Abuzaid AS, Abdellatif AD. Using multivariate analysis to develop irrigation water quality index for surface water in Kafr El-Sheikh Governorate, Egypt. Environ Technol Innov.2020; 17: 100532.
- Kükrer S, Mutlu E. Assessment of surface water quality using water quality index and multivariate statistical analyses in Saraydüzü Dam Lake, Turkey. Environ Monit Assess. 2019; 191 :1-16.
- Singh AN, Mudgal A, Tripathi RP, et al. Assessment of wastewater treatment potential of sand beds of River Ganga at Varanasi, India. AQUA—Water Infrastructure, Ecosystems and Society. 2023; 72 (5): 690–700.
- Medeiros AC, Faial KR, Faial KD, et al. Quality index of the surface water of Amazonian rivers in industrial areas in Pará, Brazil. Mar Pollut Bull. 2017; 123 (1–2): 156–64.
- Negi P, Mor S, Ravindra K. Impact of landfill leachate on the groundwater quality in three cities of North India and health risk assessment. Environ Dev Sustain.2020; 22: 1455-74.
- Gani A, Hussain A, Pathak S, et al. Analysing heavy metal contamination in groundwater in the vicinity of Mumbai’s landfill sites: an in-depth study. Top Catal. 2024; 67(15): 1009–23.
- Schober P, Boer C, Schwarte LA. Correlation coefficients: appropriate use and interpretation. Anesthesia & analgesia. 2018;126(5):1763–8.
- Charkiewicz AE, Omeljaniuk WJ, Nowak K, et al. Cadmium toxicity and health effects—a brief summary. Molecules. 2023; 28(18): 6620.
- Doyi I, Essumang D, Gbeddy G, et al. Spatial distribution, accumulation and human health risk assessment of heavy metals in soil and groundwater of the Tano Basin, Ghana. Ecotoxicol Environ Saf. 2018; 165: 540-6.
- Aiman U, Mahmood A, Waheed S, et al. Enrichment, geoaccumulation and risk surveillance of toxic metals for diferent environmental compartments from Mehmood Booti dumping site, Lahore city, Pakistan. Chemosphere. 2016; 144:2229–37.
Type of Study: Original articles |
Subject:
Environmental pollution
Received: 2025/02/11 | Accepted: 2025/04/20 | Published: 2025/06/29
Received: 2025/02/11 | Accepted: 2025/04/20 | Published: 2025/06/29
Send email to the article author
| Rights and permissions | |
 |
This work is licensed under a Creative Commons Attribution-NonCommercial 4.0 International License. |
