

Volume 9, Issue 4 (December 2024)
J Environ Health Sustain Dev 2024, 9(4): 2433-2450 |
Back to browse issues page


Download citation:
BibTeX | RIS | EndNote | Medlars | ProCite | Reference Manager | RefWorks
Send citation to:


BibTeX | RIS | EndNote | Medlars | ProCite | Reference Manager | RefWorks
Send citation to:
Ebrahimi-Khusfi Z, Soltanianzadeh Z. Temporal Changes Trend in External-Origin Dust in Arid Cities of Iran. J Environ Health Sustain Dev 2024; 9 (4) :2433-2450
URL: http://jehsd.ssu.ac.ir/article-1-817-en.html
URL: http://jehsd.ssu.ac.ir/article-1-817-en.html


Department of Environmental Science and Engineering, Faculty of Natural Resources, University of Jiroft, Jiroft, Iran
Full-Text [PDF 2804 kb]
(1470 Downloads)
| Abstract (HTML) (1464 Views)
.JPG)
Figure 1: Study cities and dust-prone areas in Iran
Data used
In the present study, three-hour data of dust events with internal and external origin recorded in synoptic stations located in dry areas of Iran in the period of 2000-2018 were used. These data were acquired from the Iran Meteorological Organization.
Internal and external dust can be measured based on registered codes in synoptic stations. Dust events recorded with codes 07 to 09, 30 to 35, and 98 indicate internal dust, while events recorded with code 06 indicate external dust 19. The descriptions of dust codes are given in Table (1).
Table 1: Synoptic weather codes related to sand and dust events 19
Table 2: The frequency of internal and external dust events in cities located in arid regions of Iran (2000-2018)
.JPG)
Figure 2: Contribution of internal and external dust events in dry cities of Iran during 2000-2018
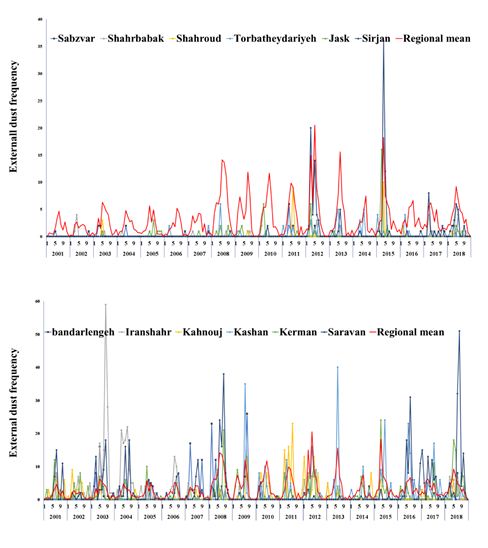
Figure 3: Monthly time series of external dust events in study cities located in arid regions of Iran
Results from Mann-Kendall analysis revealed that in April and June, 75.9% and 72. % of cities, respectively, experienced an increase, while in January, March, and May, this figure reached 69%, in October and February at 65.5%, and in July and September at 55.2% and 48.3%, respectively. In August and November and also December, 41.4% and 34.5% of cities faced an increasing trend in external events, respectively (Table 3, Figure 4).
Except for August and December, where most cities either showed no trend or a decrease in monthly external event frequency, in other months, a prevalent increasing trend in this parameter was found across the majority of cities under study. August recorded a higher number of cities with negative changes compared to other months, while more cities showed positive changes in April and June. Mann-Kendall analysis identified significant incremental changes in most months in Tabas, Kashan, and Bandar Abbas. Among the cities examined, Bam, Zahedan, and Iranshahr in the southeast of Iran demonstrated significant decreasing changes in 4, 3, and 2 months, respectively, surpassing other cities in this regard.
.JPG)
Figure 4: Mann-Kendall statistics values related to monthly changes of external-origin dust in arid cities of Iran
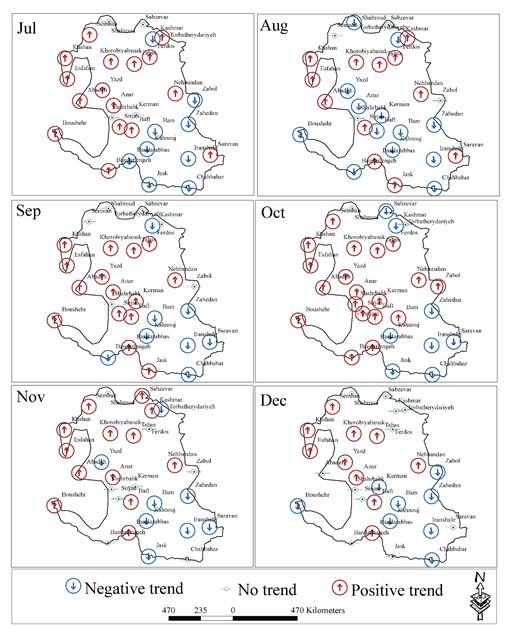
Figure 4 (Continued): Mann-Kendall statistics values related to monthly changes of external-origin dust in arid cities of Iran
Table 3: Percentage of cities with positive, negative, and stable trend changes in the monthly frequency of external-origin dust in Iran
.JPG)
Figure 5: Mann-Kendall statistics values related to seasonal changes of external-origin dust in arid cities of Iran
.JPG)
Figure 6: Mann-Kendall statistics values related to seasonal changes of external-origin dust in arid cities of Iran
Table 4: Percentage of cities with positive, negative, and stable trend changes in seasonally and annually frequency of external-origin dust in Iran
Full-Text: (998 Views)
Temporal Changes Trend in External-Origin Dust in Arid Cities of Iran
Zohre Ebrahimi-Khusfi *1, Zahra Soltanianzadeh2
1 Department of Environmental Science and Engineering, Faculty of Natural Resources, University of Jiroft, Jiroft, Iran.
2 Environmental Sciences and Technology Research Center, Department of Environmental Health Engineering, Shahid Sadoughi University of Medical Sciences, Yazd, Iran.
| A R T I C L E I N F O | ABSTRACT | |
| ORIGINAL ARTICLE | Introduction: Dust storms in arid regions lead to air pollution that jeopardizes human health and the environment. Monitoring the temporal and spatial variations of these events is crucial for mitigating their risks. Materials and Methods: This study analyzed dust events in Iran, classifying them as internal (coded 07, 30-35, 98) and external (coded 06). The frequency of each dust type was calculated for every city, and the proportion of internal and external dust events was determined. Then, the contributions of both internal and external dust sources were examined in Iranian arid cities. Finally, using Mann-Kendall test, the study analyzed changes in external-origin dust in these cities. Results: Over 58% of recorded dust events originated from external sources. Significant increases in external dust frequency were found in most months for Tabas, Kashan, and Bandar Abbas (|Z statistic| > 1.96), while significant decreases were observed in Bam, Zahedan, and Iranshahr ((|Z statistic| > 1.96). A seasonal increase in external dust was prevalent in 72%, 7%, 58.6%, and 62.1% of Iranian cities during winter, spring, summer, and autumn, respectively. Annually, 75.9% of the cities experienced rising levels of external dust, while 17.2% faced decreasing trends. Conclusion: The results can be used as an efficient tool to improve management policies and programs in order to reduce the negative effects of dust on the environment and community health in dusty urban areas. |
|
Article History: Received: 12 September 2024 Accepted: 20 November 2024 |
||
*Corresponding Author: Zohre Ebrahimi-Khusfi Zahra Soltanianzadeh Email: Zohreebrahimi2018@ujiroft.ac.ir Zahrasoltanianzadeh@gmail.com Tel: +98 9134539351 |
||
Keywords: Dust, Trend, Air Pollution, Soil, Environmental Monitoring. |
Citation: Ebrahimi-Khusfi Z, Soltanianzadeh Z. Temporal Changes Trend in External-Origin Dust in Arid Cities of Iran. J Environ Health Sustain Dev. 2024; 9(4): 2433-50.
Introduction
In recent decades, dust storms have had severe local and regional impacts on the Middle East 1. These storms can cause significant damage to buildings, roads, and other infrastructure, leading to increased repair costs and disruptions to transportation systems 2. Reduction of productivity in various economic sectors, agriculture, industry, increase in medical costs, and reduction in tourism are among the economic effects of dust storms 3, 4. Respiratory and cardiovascular diseases, allergies, and skin problems are some of the adverse consequences of dust particles on human health5-7.
One of the significant environmental challenges facing the Middle East, including Iran, is the recurring occurrence of dust storms8, 9. Dust events impacting Iran originate from both internal and external sources 10, 11. Identifying trends in these events across different regions is crucial. Researchers have correlated variations in Iran atmospheric aerosol concentration with changes in dust event frequency 12.
Studies have indicated a rise in aerosol concentration between 2000-2010, followed by a decline from 2010 to 2018. Soil moisture has been identified as a main factor influencing these trends 13. Approximately 84% of dust-laden events in southwestern Iran between 1997 and 2018 originated from external sources, with only 16% being local14.
In a study, the analysis of internal dust variations across various Iranian cities was conducted using the Dust Storm Index (DSI). Results showed a rise in these occurrences in 17% of the cities, while a decrease was noted in 13% of cities on a yearly basis 15. Baghbanan, Ghavidel and Farajzadeh 16 analyzed the evolution of dust days in 40 synoptic stations across Iran from 1986 to 2017 using the Mann-Kendall test, revealing a notable rise in dust days across all time scales.
Lotfinasabasl, Gohardoust 17 found that over half of dust events in Bam and Anar cities of Kerman province originated from external sources. In contrast, dust events in other parts of the province were primarily domestic.
Understanding the contribution of external dust events and their trends can help us determine whether these events affect urban air quality. While previous research has primarily focused on internal dust sources in arid regions, the significant role of external dust sources in air quality change has often been overlooked. This study aimed to bridge this research gap by investigating the following: (1) Quantify the contributions of internal and external dust events in urban areas in arid regions of central Iran.
(2) Analyze temporal trends in external dust events across different time scales and cities within arid regions of central Iran.
Materials and Method
Study area
Urban areas in the arid climatic zone of Iran are the focus of this study. The arid regions of Iran cover approximately 843,556 km², representing over half of the country (Fig. 1). Dust-prone areas in Iran cover a total of 100,682.4 km², of which around 61% (61,909.9 km²) are located within Iran's arid climate (National spatial planning document, Planning and Budget Organization of Iran, 2020). The average air temperature, wind speed, and rainfall in this region are approximately 19°C, 2.3 m/s, and 137 mm, respectively 18.
Figure 1: Study cities and dust-prone areas in Iran
Data used
In the present study, three-hour data of dust events with internal and external origin recorded in synoptic stations located in dry areas of Iran in the period of 2000-2018 were used. These data were acquired from the Iran Meteorological Organization.
Internal and external dust can be measured based on registered codes in synoptic stations. Dust events recorded with codes 07 to 09, 30 to 35, and 98 indicate internal dust, while events recorded with code 06 indicate external dust 19. The descriptions of dust codes are given in Table (1).
Table 1: Synoptic weather codes related to sand and dust events 19
| SYNOP Code | Weather Description |
| 06 | Dust haze |
| 07 | Raised dust or sand |
| 08 | Well-developed dust whirls (dust devils) |
| 09 | Distant or past dust storms (distant at the time of observation or past station in the past hour) |
| 30 | Decreased slight or moderate sand or dust storm with visibility < 1000 m but > 200 m |
| 31 | Stable slight or moderate sand or dust storm with visibility < 1000 m but > 200 m |
| 32 | Begun or increasing slight or moderate sand or dust storm with visibility < 1000 m but > 200 m |
| 33 | Decreased severe dust storm with visibility |
| 34 | Stable severe dust storm with visibility < 200 m |
| 35 | Begun or increasing severe dust storm with visibility < 200 m |
| 98 | Thunderstorm with dust storm or sandstorm |
To address the primary objective, the monthly and annual frequencies of events originating from both internal and external sources were calculated for each city. Subsequently, the proportion of events from internal and external sources was determined.
To address the primary objective, the study calculated monthly and annual frequencies of events originating from both internal and external sources for each city. The proportion of events attributable to each source was then determined.
Investigating the trend of changes in external-origin dust
The most important presupposition in parametric tests is that the distribution of the studied population should be normal, while a non-parametric Mann-Kendall test does not require any assumptions about the distribution of the statistical population or the investigated time series, which is one of the important advantages of this method. Its insignificant effect on the limit values that exist in some time series and the use of data ranking instead of quantitative values makes it possible for data outside the minimum trend range to be considered in the analysis, which is another advantage of this method 20-22. Accordingly, the current research employed the Mann-Kendall test to analyze the trend of external dust events across various time scales. Although lack of detection of sudden changes and the severity of the trend is one of the limitations of the Mann-Kendall method, it was used in this study due to its strengths. This test was initially developed by Mann 23 and later modified by Kendall 24. Unlike parametric tests that assume a normal distribution of the population, the non-parametric Mann-Kendall test imposes no such requirements on the distribution of the statistical population or the time series under study, offering a key advantage. Furthermore, the test utilization of ranking instead of absolute values enables consideration of data points beyond the minimum trend range, enhancing its analytical capabilities 21, 22.
The null hypothesis of the Mann-Kendall test posits the absence of a discernible trend in data series at a specified significance level. Rejecting the null hypothesis implies the presence of a trend within the data time series. The Mann-Kendall statistic was computed based on relationships outlined below.
(1)
(2)
(3)
(4)
In the given relationships, n represents observational data count, and Xk and Xl denote kth and lth data points, respectively. The parameter q signifies the number of formed groups (each with equal data and more than two members), tp stands for the count of identical data in the pth group, and Zn represents Kendall's statistic value. A negative Zn value suggests a decreasing trend, while a positive one indicates an increasing trend within the data set. At a 95% significance level, if |Zn| < 1.96, the null hypothesis is rejected, implying a significant trend in the studied parameter time series; otherwise, it is deemed to have no discernible trend.
Results
Contribution of internal and external dust in dry cities of Iran
Table (2) shows the frequency of internal and external dust events in arid cities of Iran from 2000 to 2018, while Figure (2) illustrates the relative contribution of each type of event. The table reveals that Zabol, Zahedan, and Jask faced the highest number of dust storm events, with 6567, 5183, and 4827 events, respectively, over a 19-year period. In contrast, Shahrood, Semnan, and Kashmer had significantly fewer events, totaling 63, 190, and 222, respectively, suggesting better environmental conditions in these cities.
Comparing the prevalence of internal and external dust events, it is observed that 14 cities were primarily affected by internal-origin dust, while 15 cities were predominantly impacted by external-origin dust events. Notably, 49% of the cities in arid regions experienced air pollution primarily due to local dust sources, whereas 51% suffered from air quality deterioration caused by dust transported from distant areas (Figure 2). This highlights the importance of monitoring external dust events in arid Iranian cities, a factor often overlooked in previous research. The subsequent section of the study delves into the temporal trends of external dust events in these regions.
To address the primary objective, the study calculated monthly and annual frequencies of events originating from both internal and external sources for each city. The proportion of events attributable to each source was then determined.
Investigating the trend of changes in external-origin dust
The most important presupposition in parametric tests is that the distribution of the studied population should be normal, while a non-parametric Mann-Kendall test does not require any assumptions about the distribution of the statistical population or the investigated time series, which is one of the important advantages of this method. Its insignificant effect on the limit values that exist in some time series and the use of data ranking instead of quantitative values makes it possible for data outside the minimum trend range to be considered in the analysis, which is another advantage of this method 20-22. Accordingly, the current research employed the Mann-Kendall test to analyze the trend of external dust events across various time scales. Although lack of detection of sudden changes and the severity of the trend is one of the limitations of the Mann-Kendall method, it was used in this study due to its strengths. This test was initially developed by Mann 23 and later modified by Kendall 24. Unlike parametric tests that assume a normal distribution of the population, the non-parametric Mann-Kendall test imposes no such requirements on the distribution of the statistical population or the time series under study, offering a key advantage. Furthermore, the test utilization of ranking instead of absolute values enables consideration of data points beyond the minimum trend range, enhancing its analytical capabilities 21, 22.
The null hypothesis of the Mann-Kendall test posits the absence of a discernible trend in data series at a specified significance level. Rejecting the null hypothesis implies the presence of a trend within the data time series. The Mann-Kendall statistic was computed based on relationships outlined below.
In the given relationships, n represents observational data count, and Xk and Xl denote kth and lth data points, respectively. The parameter q signifies the number of formed groups (each with equal data and more than two members), tp stands for the count of identical data in the pth group, and Zn represents Kendall's statistic value. A negative Zn value suggests a decreasing trend, while a positive one indicates an increasing trend within the data set. At a 95% significance level, if |Zn| < 1.96, the null hypothesis is rejected, implying a significant trend in the studied parameter time series; otherwise, it is deemed to have no discernible trend.
Results
Contribution of internal and external dust in dry cities of Iran
Table (2) shows the frequency of internal and external dust events in arid cities of Iran from 2000 to 2018, while Figure (2) illustrates the relative contribution of each type of event. The table reveals that Zabol, Zahedan, and Jask faced the highest number of dust storm events, with 6567, 5183, and 4827 events, respectively, over a 19-year period. In contrast, Shahrood, Semnan, and Kashmer had significantly fewer events, totaling 63, 190, and 222, respectively, suggesting better environmental conditions in these cities.
Comparing the prevalence of internal and external dust events, it is observed that 14 cities were primarily affected by internal-origin dust, while 15 cities were predominantly impacted by external-origin dust events. Notably, 49% of the cities in arid regions experienced air pollution primarily due to local dust sources, whereas 51% suffered from air quality deterioration caused by dust transported from distant areas (Figure 2). This highlights the importance of monitoring external dust events in arid Iranian cities, a factor often overlooked in previous research. The subsequent section of the study delves into the temporal trends of external dust events in these regions.
Table 2: The frequency of internal and external dust events in cities located in arid regions of Iran (2000-2018)
| Row | Study cities | Internal dust frequency | External dust frequency | Total |
| 1 | Zabol | 6484 | 83 | 6567 |
| 2 | Zahedan | 2859 | 2324 | 5183 |
| 3 | Jask | 4770 | 57 | 4827 |
| 4 | Bandarabas | 3118 | 1628 | 4746 |
| 5 | Bushehr | 1564 | 2373 | 3937 |
| 6 | bandarlengeh | 3117 | 197 | 3314 |
| 7 | Nehbandan | 1189 | 2003 | 3192 |
| 8 | Tabas | 587 | 2366 | 2953 |
| 9 | Yazd | 914 | 1980 | 2894 |
| 10 | Iranshahr | 2252 | 381 | 2633 |
| 11 | Saravan | 1690 | 553 | 2243 |
| 12 | Khur-va-biyabanak | 326 | 1309 | 1635 |
| 13 | Chabahar | 732 | 865 | 1597 |
| 14 | Esfahan | 123 | 1471 | 1594 |
| 15 | Abadeh | 473 | 859 | 1332 |
| 16 | Anar | 532 | 634 | 1166 |
| 17 | Kerman | 387 | 324 | 711 |
| 18 | Baft | 30 | 634 | 664 |
| 19 | Kahnouj | 258 | 272 | 530 |
| 20 | Sabzvar | 491 | 36 | 527 |
| 21 | Ferdos | 334 | 93 | 427 |
| 22 | Kashan | 101 | 319 | 420 |
| 23 | Bam | 198 | 204 | 402 |
| 24 | Torbatheydariyeh | 320 | 53 | 373 |
| 25 | Shahrbabak | 317 | 34 | 351 |
| 26 | Sirjan | 111 | 137 | 248 |
| 27 | Kashmar | 120 | 102 | 222 |
| 28 | Semnan | 33 | 157 | 190 |
| 29 | Shahroud | 37 | 26 | 63 |
Figure 2: Contribution of internal and external dust events in dry cities of Iran during 2000-2018
The trend of monthly changes of external-origin dust events in arid regions of Iran
Time series data on monthly variations in the frequency of external dust in the studied cities, as shown in Figure (3), reveals a wide range of changes in external event frequency spans from 0-6 in Shahrbabak, Sabzevar, and Torbat Heydarieh, to 0-179 in Tabas, 0-145 in Nehbandan, 0-122 in Esfahan, and 0-118 in Bushehr.
.JPG)
Time series data on monthly variations in the frequency of external dust in the studied cities, as shown in Figure (3), reveals a wide range of changes in external event frequency spans from 0-6 in Shahrbabak, Sabzevar, and Torbat Heydarieh, to 0-179 in Tabas, 0-145 in Nehbandan, 0-122 in Esfahan, and 0-118 in Bushehr.
Figure 3: Monthly time series of external dust events in study cities located in arid regions of Iran
Results from Mann-Kendall analysis revealed that in April and June, 75.9% and 72. % of cities, respectively, experienced an increase, while in January, March, and May, this figure reached 69%, in October and February at 65.5%, and in July and September at 55.2% and 48.3%, respectively. In August and November and also December, 41.4% and 34.5% of cities faced an increasing trend in external events, respectively (Table 3, Figure 4).
Except for August and December, where most cities either showed no trend or a decrease in monthly external event frequency, in other months, a prevalent increasing trend in this parameter was found across the majority of cities under study. August recorded a higher number of cities with negative changes compared to other months, while more cities showed positive changes in April and June. Mann-Kendall analysis identified significant incremental changes in most months in Tabas, Kashan, and Bandar Abbas. Among the cities examined, Bam, Zahedan, and Iranshahr in the southeast of Iran demonstrated significant decreasing changes in 4, 3, and 2 months, respectively, surpassing other cities in this regard.
Figure 4: Mann-Kendall statistics values related to monthly changes of external-origin dust in arid cities of Iran
Figure 4 (Continued): Mann-Kendall statistics values related to monthly changes of external-origin dust in arid cities of Iran
Table 3: Percentage of cities with positive, negative, and stable trend changes in the monthly frequency of external-origin dust in Iran
| Month | Cities with stable trend (%) | Cities with a positive trend (%) | Cities with a negative trend (%) |
| Jan | 24.1 | 69 | 6.9 |
| Feb | 17.2 | 65.5 | 17.2 |
| Mar | 3.4 | 69 | 27.6 |
| Apr | 0 | 75.9 | 24.1 |
| May | 3.4 | 69 | 27.6 |
| Jun | 0 | 72.4 | 27.6 |
| Jul | 13.8 | 55.2 | 31 |
| Aug | 13.8 | 41.4 | 44.8 |
| Sep | 20.7 | 48.3 | 31 |
| Oct | 6.9 | 65.5 | 27.6 |
| Nov | 31 | 41.4 | 27.6 |
| Dec | 37.9 | 34.5 | 27.6 |
The trend of seasonally and annually changes of external-origin dust in arid regions of Iran
Mann-Kendall statistic values for changes in the frequency of external dust events on a seasonal and annual scale are depicted in Figures 5 and 6, respectively.
According to the results presented in Figure 5 and Table 4, over 7% of the studied cities experienced an increase in the frequency of winter dust storms, with significant changes observed in Isfahan, Khorobiabank, Shahroud, Zabol, and Tabas. Conversely, 24.1% of cities exhibited a non-significant decrease, while the remaining cities showed no clear trend. Regarding spring dust, a significant ascending trend was observed in 76% of cities, while 21% experienced a descending trend. Approximately 3% showed no specific trend. Notably, significant changes were observed in Isfahan, Kashan, Khorbiabank, Semnan, Sirjan, Tabas, Torbat Heydarieh, and Yazd for cities with increasing trends, and in Bam for cities with decreasing trends.
In summer, 58.6%, 31%, and 10.3% of cities experienced increasing, decreasing, and stable trends in external dust, respectively. Substantial changes were observed in Abadeh, Kashan, Sirjan, and Tabas for cities with increasing trends, and in Bam and Iranshahr for cities with decreasing trends.
For autumn, a significant increase trend was seen in 62.1% of cities, particularly in Abadeh, Kashan, Khorubiyabank, and Tabas. Conversely, 34.5% of cities experienced a non-significant decline, while 3% exhibited no specific trend.
A notable trend emerged in annual dust patterns, with 75.9% of cities experiencing an increase, 17.2% a decrease, and 6.9% showing no significant change. The most significant increases occurred in Abadah, Isfahan, Kashan, Khorubiyabank, Semnan, Sirjan, Tabas, Torbat Heydarieh, and Zabol, while the most significant decreases were noted in Bam and Iranshahr (Figure 6, Table 4).
Figure 5: Mann-Kendall statistics values related to seasonal changes of external-origin dust in arid cities of Iran
Figure 6: Mann-Kendall statistics values related to seasonal changes of external-origin dust in arid cities of Iran
Table 4: Percentage of cities with positive, negative, and stable trend changes in seasonally and annually frequency of external-origin dust in Iran
| Temporal scale |
Cities with stable trend (%) |
Cities with a positive trend (%) |
Cities with a negative trend (%) |
| Winter | 3.4 | 72.4 | 24.1 |
| Spring | 3.4 | 75.9 | 20.7 |
| Summer | 10.3 | 58.6 | 31 |
| Autumn | 3.4 | 62.1 | 34.5 |
| Annual | 6.9 | 75.9 | 17.2 |
In general, changes in the external-origin dust frequency in dry areas of Iran from January to May have shown a significant increase, followed by an insignificant increase in other months (except August). Only in August, the trend of changes in foreign events had a decreasing and insignificant trend. Furthermore, arid regions of Iran experienced significant increases in external dust events during winter, spring, and autumn, as well as annually. In contrast, summer saw primarily insignificant changes (Table 5).
Table 5: Mann-Kendall statistics values related to changes of external-origin dust in arid region of Iran in different time scales
Table 5: Mann-Kendall statistics values related to changes of external-origin dust in arid region of Iran in different time scales
| Month | Z-value | Season | Z-value |
| Jan | 2.7** | Winter | 2.6* |
| Feb | 2.4* | ||
| Mar | 2.2* | ||
| Apr | 2.7** | Spring | 2.7** |
| May | 2.4* | ||
| Jun | 1.8 | ||
| Jul | 1.5 | Summer | 1.1 |
| Aug | -0.2 | ||
| Sep | 0.7 | ||
| Oct | 1.7 | Autumn | 2* |
| Nov | 1.3 | ||
| Dec | 1.3 | ||
| Annual | 2.2* | ||
* and ** are significant at α = 0.05 and α = 0.01 levels, respectively.
Discussion
The rise in dust events signifies the worsening of wind erosion, land degradation, and the spread of desert ecosystems in various regions 25, 26. The occurrence of dust storms in nearby areas (internal origin) and sometimes far from urban environments (external origin) cause air pollution and increase the concentration of suspended particles in the atmosphere 27, 28. This could result in a rise in respiratory and cardiovascular issues among nearby residents and a deterioration in their quality of life 29, 30. Therefore, in addition to determining the contribution of internal and external dust events, it is crucial to understand the trend of their changes in different regions, especially dry urban environments. According to the study findings, internal-origin dust prevailed in 49% of dry cities of Iran, while external-origin dust prevailed in the remaining 51% of cities. The findings of this study are consistent with those of some Iranian researchers on the greater proportion of external dust events in certain regions of Iran, particularly in the southwestern regions 14. The dust in this area primarily originates in Iraq from land prone to wind erosion, then drifts to Iran 31.
The trend of changes in external events in over 65% of arid cities in Iran from January to June showed a significant increase, while in other months, the trend was negative and insignificant. There was a seasonal increase in dust pollution from external events in over 58% of the cities studied during autumn and summer and in approximately two-thirds of urban areas during winter and spring. Generally, over 7% of Iran’s arid cities experience an annual increase in dust pollution from external storms.
Among the study cities, Isfahan, Kashan, Khuro-va-biyabank, Yazd, Semnan, and Tabas exhibited a more severe situation compared to others. These cities not only had a higher frequency of these events but also showed an incremental and significant trend in their changes during the study period. The results of this study are somewhat in line with the findings of Yarmoradi et al. (2020), who highlighted the rising trend in dust event frequency at Tabas station. They also noted a significant increase in dusty days at Zabol and Zahedan stations, contrasting with the present study results. This discrepancy can be attributed to their focus on dusty days as opposed to the examination of external origin events. Increasing trends in dust pollution can exacerbate respiratory problems, especially in high-risk cities for vulnerable populations such as children and the elderly32. Reducing air quality can affect the performance of urban infrastructure such as public transport systems, streets, and water pumps and can lead to a reduction in economic activities, especially in the agricultural and tourism sectors33, 34. In general, dust events can be considered a natural crisis in most of the dry cities of Iran, and city management should formulate crisis response and preparedness plans and raise awareness with the citizens in this regard.
Dust pollution resulting from the entry of external particles into the mentioned residential zones signifies an increase in land degradation and the expansion of desert areas in the erodible vicinity. Yazd-Ardakan Plain, located approximately 60 km northwest of Yazd city, serves as a major dust production source 35, 36. Given the prevailing erosive winds from the northwest in this city 37, it is likely that the Yazd-Ardakan plain contributes to the external sources of dust particles causing air pollution in the area. There are many areas prone to dust production around the cities of Kashan and Semnan. The main direction of dusty winds is from the southwest 38, and abandoned agricultural lands, poor pastures, and bare lands are identified as areas prone to dust production around them (Figure 1). Therefore, it can be said that these areas are sources of dust particle erosion that, after the occurrence of dust storms and the transfer of particles towards these cities, can cause air quality deterioration. The city of Isfahan was also identified in this study as one of the most affected cities by foreign dust. As shown in Figure (1), areas susceptible to wind erosion and dust storms are mainly in the southern and eastern regions. During hot seasons, dusty winds come from the west and south-west 39, making these areas unlikely to collect dust particles. It appears that eroded dust particles are transferred from other areas to Isfahan, requiring further research, which is not part of the present study goals.
The results can also contribute to a deeper understanding of dust challenges in Iran and can be used as a tool for better awareness of global environmental impacts. In general, the findings showed that 58% of dust events in dry areas of Iran have external sources. This shows that many of the country's dust problems are affected by environmental and climatic factors outside the borders of Iran. This issue can be related to the issue of desertification and climate change, especially in neighboring countries40.
Generally, the study highlights a significant increase in external-origin dust across many Iranian cities, indicating a need for several urban management interventions: enhancing monitoring and early warning systems, expanding green spaces such as parks and green roofs to mitigate dust effects, considering urban design and density to reduce wind speed and dust emissions, and enforcing stringent air quality regulations to limit emissions, particularly during dusty seasons.
Conclusion
This study has investigated the long-term trend of changes in the frequency of external dust events in arid urban areas of Iran in the period of 2000-2018. The results showed that external dust events have increased significantly in dry urban areas of Iran, especially in recent years. This increase has directly affected the air quality and the health of citizens, indicating that air pollution in these areas is mainly caused by external sources. The seasonal and spatial patterns of dust events also show that the central regions of Iran are more exposed to this phenomenon. The findings highlighted the importance of comprehensive and integrated management of dust sources in dry areas of Iran. Measures such as revitalization of vegetation, stabilization of moving sand, improvement of water resource management, and development of dust monitoring and forecasting systems can be effective in reducing the destructive effects of this phenomenon. However, to achieve better results, there is a need to carry out more extensive studies in the field of dust transmission mechanisms, its health effects, and to evaluate the effectiveness of control strategies. Given that external sources of dust have not been specifically identified for the studied cities, establishing a direct relationship between these trends and climate change remains challenging. Therefore, it is recommended that future studies focus on identifying these sources and exploring their climate impacts on external events to increase our understanding of the main drivers of changes in these events.
Acknowledgments
This research was supported by the University of Jiroft under grant NO: 4812-03-2-299729, and the authors appreciate the educational and Research Vice-Chancellor of the university. The authors also would like to thank the Iranian Meteorological Organization for providing the required information about meteorological parameters and the AI language model Gemini in improving the grammatical accuracy and sentence fluency of this manuscript.
Conflict of Interest
The authors declare that there is no conflict of interest.
Funding
This research was supported by the University of Jiroft under grant NO: 4812-03-2-299729.
Ethical Approval
The authors fully addressed ethical issues including plagiarism, informed consent, misconduct, data fabrication and/or falsification, double publishing and/or submission, redundancy, etc.
Code of Ethics
This study aimed to analyze temporal variations in external dust occurrences across multiple time scales in various cities within Iran arid central regions. Ethical considerations were not applicable to this research.
Authorsʼ contributions
All authors contributed to the study conception and design. Data collection and analysis were performed by Zohre Ebrahimi-Khusfi, and Zahra Soltanianzadeh. The first draft of the manuscript was written by Zohre Ebrahimi-Khusfi and other author commented on previous versions of the manuscript. All authors read and approved the final manuscript.
This is an Open-Access article distributed in accordance with the terms of the Creative Commons Attribution (CC BY 4.0) license, which permits others to distribute, remix, adapt, and build upon this work for commercial use.
References
1. Mohajeri SH, Eydi Z, Mirshafiei SR. Mapping the distribution and temporal trends of dust storm sources in the Middle East using satellite data. Natural Hazards. 2024;120(1):389-407.
2. Miri A, Middleton N. Long-term impacts of dust storms on transport systems in south-eastern Iran. Natural Hazards. 2022;114(1):291-312.
3. Mahmoudi L, Doumari SA, Safarianzengir V, et al. Monitoring and prediction of dust and investigating its environmental impacts in the Western Half of Iran and the Eastern Borders of Turkey and Iraq, using remote sensing and GIS. Journal of the Indian Society of Remote Sensing. 2021;49:713-24.
4. Xu X, Liu X, Yang X, et al. Assessing the impact of dust events on the Holiday Climate Index in the Taklimakan Desert region. Int J Biometeorol. 2024;68(6):1073-9.
5. Luo Y, Yao Q, Ding P, et al. Health impacts of an extreme dust event: a case and risk assessment study on airborne bacteria in Beijing, China. Environ Sci Eur. 2024;36(1):41.
6. D'Amato G, Akdis CA. Desert dust and respiratory diseases: further insights into the epithelial barrier hypothesis. Allergy-Wiley Online Library; 2022;77(12):3490-2.
7. Karshieva D, Nazarova F, Tolibova Z. Atmospheric dust and its effects on human health. Academicia: An Int Multidiscip Res J. 2021;11(3): 1168-72.
8. Jafari M, Mesbahzadeh T, Masoudi R, et al. Dust storm surveying and detection using remote sensing data, wind tracing, and atmospheric thermodynamic conditions (case study: Isfahan Province, Iran). Air Qual Atmos Health. 2021;14:1301-11.
9. Soleimani-Sardo M, Shirani M, Strezov V. Heavy metal pollution levels and health risk assessment of dust storms in Jazmurian region, Iran. Sci Rep. 2023;13(1):7337.
10. Rashki A, Middleton NJ, Goudie AS. Dust storms in Iran–Distribution, causes, frequencies and impacts. Aeolian Res. 2021;48:100655.
11. Dargahian F, Mousivand Y, Razavizadeh S, et al. Identifying dust sources affecting Southwestern Iran (Khuzestan Province) using remote sensing techniques and HYSPLIT Model. Journal of the Indian Society of Remote Sensing. 2023;51(3):565-83.
12. Mousavi H, Panahi DM, Kalantari Z. Dust and climate interactions in the Middle East: spatio-temporal analysis of aerosol optical depth and climatic variables. Sci Total Environ. 2024;927:172176.
13. Yousefi R, Wang F, Ge Q, et al. Analysis of the winter AOD trends over Iran from 2000 to 2020 and associated meteorological effects. Remote Sens (Basel). 2023;15(4):905.
14. Hamzeh NH, Kaskaoutis DG, Rashki A, et al. Long-term variability of dust events in southwestern Iran and its relationship with the drought. Atmosphere. 2021;12(10): 1350.
15. Ghamkhar M, Roustaei F, Ebrahimi-Khusfi Z. Spatiotemporal variations of internal dust events in urban environments of Iran, Southwest Asia. Environ Sci Pollut Res Int. 2023;30(11):29476-93.
16. Baghbanan P, Ghavidel Y, Farajzadeh M. Temporal long-term variations in the occurrence of dust storm days in Iran. Meteorology and Atmospheric Physics. 2020;132:885-98.
17. Lotfinasabasl S, Gohardoust A, Dargahian F, et al. Analysis of dusty and erosive winds in Kerman province in order to provide a calendar for forecasting and managing dust control. Iranian Journal of Forest and Range Protection Research. 2022;19(2):179-211.
18. Ebrahimi-Khusfi Z, Taghizadeh-Mehrjardi R, Mirakbari M. Evaluation of machine learning models for predicting the temporal variations of dust storm index in arid regions of Iran. Atmos Pollut Res. 2021;12(1): 134-47.
19. O’Loingsigh T, McTainsh G, Tews E, et al. The Dust Storm Index (DSI): a method for monitoring broadscale wind erosion using meteorological records. Aeolian Res. 2014;12:29-40.
20. Mohammad L, Mondal I, Bandyopadhyay J, et al. Assessment of spatio-temporal trends of satellite-based aerosol optical depth using Mann–Kendall test and Sen’s slope estimator model. Geomat Nat Hazards Risk. 2022;13(1): 1270-98.
21. Hamed KH. Trend detection in hydrologic data: the Mann–Kendall trend test under the scaling hypothesis. J Hydrol (Amst). 2008;349(3-4):350-63.
22. Yarmoradi Z, Nasiri B, Mohammadi GH, et al. Long-term characteristics of the observed dusty days and its relationship with climatic parameters in East Iran. Arabian Journal of Geosciences. 2020;13(6):242.
23. Mann HB. Nonparametric tests against trend. Econometrica. 1945:245-59.
24. Kendall MG. Rank correlation methods. 1948.
25. Boroughani M, Mirchooli F, Hadavifar M, et al. Mapping land degradation risk due to land susceptibility to dust emission and water erosion. Soil. 2023;9(2):411-23.
26. Zucca C, Fleiner R, Bonaiuti E, et al. Land degradation drivers of anthropogenic sand and dust storms. Catena (Amst). 2022;219:106575.
27. Ye Q, Zheng X. Distribution, transport, and impact on air quality of two typical dust events in China in 2021. Atmosphere. 2023;14(3):432.
28. Filonchyk M. Characteristics of the severe March 2021 Gobi Desert dust storm and its impact on air pollution in China. Chemosphere. 2022;287:132219.
29. Pouri N, Karimi B, Kolivand A, et al. Ambient dust pollution with all-cause, cardiovascular and respiratory mortality: a systematic review and meta-analysis. Sci Total Environ. 2024;912:168945.
30. Herrera-Molina E, Gill TE, Ibarra-Mejia G, et al. Associations between dust exposure and hospitalizations in a dust-prone city, Lubbock, TX, USA. Air Qual Atmos Health. 2024;17(5): 1091-105.
31. Alizadeh‐Choobari O, Ghafarian P, Owlad E. Temporal variations in the frequency and concentration of dust events over Iran based on surface observations. Int J Climatol. 2016;36(4):2050-62.
32. Zhang X, Zhao L, Tong DQ, et al. A systematic review of global desert dust and associated human health effects. Atmosphere. 2016;7(12):158.
33. Eusébio C, Carneiro MJ, Madaleno M, et al. The impact of air quality on tourism: a systematic literature review. Journal of Tourism Futures. 2021;7(1):111-30.
34. Stefanski R, Sivakumar MV. Impacts of sand and dust storms on agriculture and potential agricultural applications of a SDSWS. InIOP conference series: earth and environmental science. IOP Publishing. 2009;7(1):p.012016.
35. Ekhtesasi M, Sepehr A. Investigation of wind erosion process for estimation, prevention, and control of DSS in Yazd–Ardakan plain. Environ Monit Assess. 2009;159:267-80.
36. Iraji F, Memarian MH, Joghataei M, et al. Determining the source of dust storms with use of coupling WRF and HYSPLIT models: a case study of Yazd province in central desert of Iran. Dynamics of Atmospheres and Oceans. 2021;93:101197.
37. Saremi Naeini MA. Estimate the frequency of speed and direction of erosive winds and generating dust storms in Yazd province by using Windrose, Stormrose and Sandrose. Desert Management. 2017;4(8):96-106.
38. Ebrahimi-Khusfi Z, Mirakbari M, Khosroshahi M. Vegetation response to changes in temperature, rainfall, and dust in arid environments. Environ Monit Assess. 2020;192(11):691.
39. Ebrahimi-Khusfi Z, Nafarzadegan AR, Ebrahimi-Khusfi M, et al. Monitoring the water surface of wetlands in Iran and their relationship with air pollution in nearby cities. Environ Monit Assess. 2022;194(7):488.
40. Dargahian F, Gohardoust A, Lotfinasabasl S, et al. Determining the contribution of neighboring countries in the emission of dust to Khuzestan province. Iranian Journal of Range and Desert Research. 2024;31(1):41-50.
Type of Study: Original articles |
Subject:
Environmental pollution
Received: 2024/09/12 | Accepted: 2024/11/20 | Published: 2024/12/29
Received: 2024/09/12 | Accepted: 2024/11/20 | Published: 2024/12/29
Send email to the article author
| Rights and permissions | |
 |
This work is licensed under a Creative Commons Attribution-NonCommercial 4.0 International License. |
