

Volume 6, Issue 1 (March 2021)
J Environ Health Sustain Dev 2021, 6(1): 1184-1195 |
Back to browse issues page


Download citation:
BibTeX | RIS | EndNote | Medlars | ProCite | Reference Manager | RefWorks
Send citation to:


BibTeX | RIS | EndNote | Medlars | ProCite | Reference Manager | RefWorks
Send citation to:
Madadizadeh F, Sefidkar R. Ranking and Clustering Iranian Provinces Based on COVID-19 Spread: K-Means Cluster Analysis. J Environ Health Sustain Dev 2021; 6 (1) :1184-1195
URL: http://jehsd.ssu.ac.ir/article-1-280-en.html
URL: http://jehsd.ssu.ac.ir/article-1-280-en.html


Center For Healthcare Data Modeling, Departments of Biostatistics and Epidemiology, School of Public Health, Shahid Sadoughi University of Medical Sciences, Yazd, Iran.
Full-Text [PDF 1987 kb]
(550 Downloads)
| Abstract (HTML) (1300 Views)
.png)
.png)
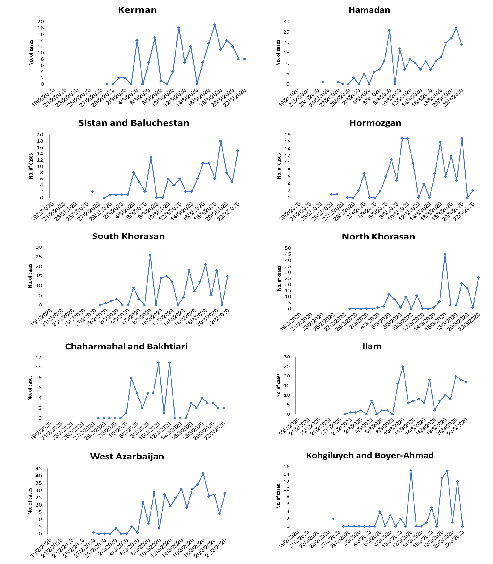

Figure 2: Number of new confirmed cases of COVID -19 in provinces of Iran, Feb 19 to Mar 2, 2020.
.png)
Figure 3: Cumulative frequency of new confirmed cases of COVID -19 in provinces of Iran, Feb 19 to Mar 2, 2020
.png)
Figure 4: Adjusted cumulative frequency of new confirmed cases of COVID -19 in provinces of Iran,
Feb 19 to Mar 2, 2020.
.png)
Figure 5: Number of new cases, Cumulative and death and recovered from COVID 19 per day in Iran, Feb 19 to Mar 2, 2020
Full-Text: (694 Views)
Ranking and Clustering Iranian Provinces Based on COVID-19 Spread: K-Means Cluster Analysis
Farzan Madadizadeh 1, Reyhane Sefidkar 1*
1 Center For Healthcare Data Modeling, Departments of Biostatistics and Epidemiology, School of Public Health, Shahid Sadoughi University of Medical Sciences, Yazd, Iran.
Farzan Madadizadeh 1, Reyhane Sefidkar 1*
1 Center For Healthcare Data Modeling, Departments of Biostatistics and Epidemiology, School of Public Health, Shahid Sadoughi University of Medical Sciences, Yazd, Iran.
| A R T I C L E I N F O | ABSTRACT | |
| ORIGINAL ARTICLE | Introduction: The Coronavirus has crossed geographical borders. This study was performed to rank and cluster Iranian provinces based on coronavirus disease (COVID-19) recorded cases from February 19 to March 22, 2020. Materials and Methods: This cross-sectional study was conducted in 31 provinces of Iran using the daily number of confirmed cases. Cumulative Frequency (CF) and Adjusted CF (ACF) of new cases for each province were calculated. Characteristics of provinces like population density, area, distance from the original epicenter (Qom province), altitude from sea level, and Human Development Index (HDI) were used to investigate their correlation with ACF values. Spearman correlation coefficient and K-Means Cluster Analysis (KMCA) were used for data analysis. Statistical analyses were conducted in RStudio. The significant level was set at 0.05. Results: There were 21,638 infected cases with COVID-19 in Iran during the study period. Significant correlations between ACF values and province HDI (r = 0.46) and distance from the original epicenter (r = -0.66) was observed. KMCA, based on both CF and ACF values, classified provinces into 10 clusters. In terms of ACF, the highest level of spreading belonged to cluster 1 (Semnan and Qom provinces), and the lowest one belonged to cluster 10 (Kerman, Sistan and Baluchestan, Chaharmahal and Bakhtiari and Busher provinces). Conclusion: This study showed that ACF gives a real picture of each province's spreading status. KMCA results based on ACF identify the provinces that have critical conditions and need attention. Therefore, using this accurate model to identify hot spots to perform quarantine is recommended. |
|
| Article History: Received: 12 November 2020 Accepted: 20 January 2021 |
||
| *Corresponding Author: Reyhane Sefidkar Email: reyhanesefidkar@gmail.com Tel: +98 3531492249 |
||
| Keywords: COVID-19, Disease, Epidemiology, Cluster Analysis, Iran. |
Citation: Madadizadeh F, Sefidkar R. Ranking and Clustering Iranian Provinces Based on COVID-19 Spread: K-Means Cluster Analysis. J Environ Health Sustain Dev. 2021; 6(1): 1184-95.
Introduction
These days, a strange unwanted guest has drastically surprised the people in most countries all over the world. A 2019 novel coronavirus (2019-nCoV), a new member of the coronavirus family, mainly causes acute infection in the human respiratory system at early stages 1. This new Coronavirus first emerged in December 2019 in China by identifying a cluster of pneumonia cases of unknown etiology and was identified from the throat swab sample on January 7 2,3. The International Committee on Taxonomy of Viruses (ICTV) called the newly described Coronavirus as Severe Acute Respiratory Syndrome Coronavirus 2 (SARS-CoV-2) and the caused disease as coronavirus disease-2019 (COVID-19) 4. Up to now, the world has witnessed the deadly and destructive outbreak of various coronavirus-related diseases including SARS during 2002-2003 and the Middle East respiratory syndrome (MERS) in 2012 with a case fatality rate of 10 and 35.5%, respectively 5,6. Researches have shown that the COVID-19 has a humantohuman transmission and its incubation period varies between 2-14 days 7,8. Although the transmission mostly occurs when a patient is symptomatic, the studies have indicated that it may also happen during the asymptomatic incubation period 9. Clinical manifestations of this disease include fever, cough, shortness of breath, breathing difficulties, and other complications related to respiratory tract involvement so that, in more severe cases, the infection can cause pneumonia, severe acute respiratory syndrome, and even death 7,8,9. Based on the warnings, older adults and people with serious heart disease, diabetes, and lung disease may hurt severely from the COVID-19 10. Long infectious periods, rapid increases in the number of cases, and the absence of definitive treatment have made this disease a global challenge 11,12. Until March 22, 2020, the total number of infected cases worldwide is 337,459, 14,640 of which have lost their lives. While China has the most total confirmed cases, the peak of mortality due to the COVID-19 has been reported in Italy with a total number of 5,476 deaths 13. On February 19, 2020, the first death cases due to the COVID-19 were announced in Qom province (Iran), after that, the ascending trend of outbreak was started across the other provinces. According to the Iranian Ministry of Health and Medical Education (IMHME) reports, up to March 22, 2020, there were 21,638 confirmed cases in Iran with 1,685 deaths and 7,913 remissions, and Tehran province has been reported to have the highest number of infected cases among the other provinces. Although the authorities have started to confront this epidemic by shutting down the schools and universities, refusing non-local travelers in some provinces, reducing working hours for some days, implementing forms of remote work by many companies for the employees, requesting the individuals to stay at home in self-quarantine, etc., still there is a quick increase in the number of infected cases 5. Given the rapid outbreak of the COVID-19 in Iran, this study was conducted in order to identify the spreading trend of this disease in Iran and all its provinces from February 19 to March 22, 2020, using the recorded data from the IMHME and also to find similar provinces according to the disease spread using K-Means Cluster Analysis (KMCA). There were various studies which used KMCA to classify different things related to Covid-19 pandemic as follows. In 2020, Imtyaz et al. classified thirty worst affected countries and their governments' responses to the Covid-19 pandemic. KMCA results showed there were five different clusters 14. Mahmudan in 2020, by using KMCA categorized different regions of Java province of Indonesia based on confirmed cases of Covid-19. At the final step, all studied areas were classified in to three clusters 15. Doroshenko et al. in 2020 compared different clustering algorithms to analyze the distribution of 1113 Covid-19 cases which were followed by two months in Italy. Results showed that KMCA had best performance with classifying areas in six clusters among other methods 16. Evolutionary clustering which relies on KMCA was also used to analyze 43 million textual tweets about Covid-19 spread on Twitter between March 22 and March 30, 2020. Six clusters were identified by KMCA which were sorted in a decreasing order. The results indicated that "Covid-19 pandemic" term was the most trended tweet 17. In 2020, different areas of Italy were classified according to SARS-CoV-2 spread. Results of KMCA depicted that there were three independent clusters 18.
According to what was shown in the literature review, no study used KMCA to classify Iran provinces based on the prevalence of COVID-19. So, This study was conducted to rank and cluster Iranian provinces using KMCA based on coronavirus disease (COVID-19) recorded cases during February 19 to March 22, 2020, and investigating the relationship between disease spread and characteristics of provinces such as population density, area, distance from the original epicenter (Qom province), altitude from sea level, and Human Development Index (HDI).
Materials and Methods
Data collection
During the study period, from February 19 to March 22, 2020, the daily regional distribution of the epidemic was closely tracked, extracted, and collected through IMHME. There were 21,638 confirmed cases in Iran, with 1,685 deaths and 7,913 remissions.
The information included the daily number of newly confirmed cases, remissions, and deaths due to the COVID-19 in all the 31 provinces of Iran within a 33-day interval. Based on the last population census conducted in 2016 in Iran, the population of Iran is about 79.9 million people. Table 1 presents the information on the cumulative frequency of the infected cases, population size, area, population density, distance from the original epicenter (Qom province), and altitude from sea level, and HDI for each province
Statistical analysis
KMCA was applied to identify the provinces with similar spreading patterns in terms of the COVID-19 outbreak based on Cumulative Frequency (CF) and Adjusted Cumulative Frequency (ACF), which provides a more accurate picture of the epidemic. KMCA is a distance-based algorithm, where the distances are calculated to assign a point to a cluster. In this method, each cluster is associated with a centroid, and the aim is to minimize the sum of distances between the points and their respective cluster centroid 18. Each cluster represents the CF values, and all clusters are sorted in a descending order from first to last. For instance, the first and last clusters represent the highest and lowest CF/ ACF values. The number of iterations was set as 100, and the cluster centroid shows the average of CF/ACF values assigned to that cluster.
Furthermore, the spearman correlation coefficient was used to assess the strength of the linear relationship between ACF and the variables presented in table 1. All data analyses were conducted in the RStudio environment, Version 1.2.5042, and in Microsoft Excel 2016. The significant level was set at 0.05.
Ethical issue
This study was approved by the Ethics Committee of Shahid Sadoughi University of Medical Sciences (IR.SSU.SPH.REC.1399.195.)
Results
There were 21,638 infected, 7,913 recovered, and 2,299 death cases with COVID-19 in Iran during the study period. Figure 1 shows the number of newly infected, death, and recovered cases due to the COVID -19 from February 19 to March 22, 2020, in Iran. Qom province, as the seventh most populous city of Iran, was the first province of Iran contaminated with the Coronavirus on February 19, 2020, with 2 cases, and Bushehr province was the last province with five cases on March 5, 2020. For each province, the frequency of daily new infected cases and cumulative frequencies are presented in (Figure 2) and (Figure 3) respectively. Among Iran's provinces, maximum and minimum CF was observed in Tehran with 5098 cases (23.56%) and Bushehr with 55 cases (0.25%). ACF values for each province are mapped in figure 4. By March 22, the ACF of the infected case was equal to 270.72, per one million, in Iran with the maximum ACFs belonged to Semnan (918.33) and Qom (911.56) provinces. Figure 5 shows the CF, new cases, recovered, and death per day in Iran. As demonstrated in figure 5, there is an increasing trend in CF in Iran. Results of the KMCA based on CF and ACF of the confirmed cases showed that all the 31 provinces of Iran are classified into 10 clusters according to the similarity index of Euclidean distance (Table 2). In clustering based on the CF, Tehran and Isfahan had a separate specific cluster, but in clustering based on ACF, they had a common cluster. Fars and Khuzestan, Chaharmahal and Bakhtiari and Bushehr, Gilan, and Alborz had the same cluster in both types of clustering. There was a significant positive relationship between HDI (r = 0.46, p=0.008), also there was a significant negative relationship between ACF and distance from Qom province
(r = -0.66, p < 0.001). There was a negative and positive insignificant relationships between ACF and area (km2) (r = -0.30, p = 0.10), height above sea level (r = -0.13, p = 0.47) and population density (r = 0.20, p = 0.27).
Table 1: Demographic features, cumulative frequency and adjusted cumulative frequency of the cases in provinces of Iran.
| No. | Province | CF * | CF/ Sum of CFs | Population Census 2016 |
ACF** | Area(km2) | Altitude (height above sea) (m) |
Population density (people/km2) | Distance from original Epicenter(Qom) | HDI*** |
| 1 | Tehran | 5098 | 0.235604 | 13267637 | 384.4645551 | 18814 | 1368 | 704.8 | 145 | 0.834 |
| 2 | Qom | 1178 | 0.054441 | 1292283 | 911.5650365 | 11240 | 932 | 115.0 | 0 | 0.816 |
| 3 | Gilan | 1191 | 0.055042 | 2530696 | 470.6215207 | 14042 | -8 | 180.2 | 672 | 0.805 |
| 4 | Isfahan | 1976 | 0.091321 | 5120850 | 385.873439 | 107018 | 1571 | 47.9 | 283 | 0.83 |
| 5 | Alborz | 1177 | 0.054395 | 2712400 | 433.9330482 | 5833 | 1380 | 465.0 | 165 | 0.834 |
| 6 | Mazandaran | 1700 | 0.078565 | 3283582 | 517.7337515 | 23756 | 54 | 138.2 | 390 | 0.825 |
| 7 | Markazi | 882 | 0.040762 | 1429475 | 617.0097413 | 29127 | 1708 | 49.1 | 131 | 0.791 |
| 8 | Qazvin | 669 | 0.030918 | 1273761 | 525.216269 | 15567 | 1297 | 81.8 | 234 | 0.796 |
| 9 | Semnan | 645 | 0.029809 | 702360 | 918.3324791 | 97491 | 1130 | 7.2 | 281 | 0.822 |
| 10 | Golestan | 391 | 0.01807 | 1868819 | 209.2454374 | 20117 | 1065 | 92.9 | 524 | 0.778 |
| 11 | Razavi Khorasan | 858 | 0.039652 | 6434501 | 133.3436734 | 118018 | 1065 | 54.5 | 956 | 0.781 |
| 12 | Fars | 505 | 0.023339 | 4851274 | 104.0963673 | 122608 | 1549 | 39.6 | 760 | 0.808 |
| 13 | Lorestan | 476 | 0.021998 | 1760649 | 270.3548521 | 28294 | 1347 | 62.2 | 334 | 0.779 |
| 14 | East Azerbaijan | 813 | 0.037573 | 3909652 | 207.9468966 | 45651 | 1345 | 85.6 | 657 | 0.785 |
| 15 | Khuzestan | 444 | 0.020519 | 4710509 | 94.25732973 | 64055 | 10 | 73.5 | 662 | 0.802 |
| 16 | Yazd | 725 | 0.033506 | 1138533 | 636.7843532 | 73477 | 1230 | 15.5 | 486 | 0.824 |
| 17 | Zanjan | 394 | 0.018209 | 1057461 | 372.5905731 | 19164 | 1638 | 55.2 | 371 | 0.771 |
| 18 | Kurdistan | 238 | 0.010999 | 1603011 | 148.4705969 | 29137 | 1463 | 55.0 | 449 | 0.743 |
| 19 | Ardabil | 289 | 0.013356 | 1270420 | 227.4838242 | 17800 | 1338 | 71.4 | 625 | 0.756 |
| 20 | Kermanshah | 175 | 0.008088 | 1951443 | 89.67722859 | 24998 | 1374 | 78.1 | 423 | 0.796 |
| 21 | Kerman | 169 | 0.00781 | 2938988 | 57.50278667 | 183285 | 1760 | 16.0 | 864 | 0.778 |
| 22 | Hamadan | 243 | 0.01123 | 1758264 | 138.2045017 | 20173 | 1803 | 87.2 | 280 | 0.775 |
| 23 | Sistan and Baluchestan | 134 | 0.006193 | 2775049 | 48.28743565 | 180726 | 1344 | 15.4 | 1340 | 0.688 |
| 24 | Hormozgan | 148 | 0.00684 | 1776415 | 83.31386528 | 70697 | 9 | 25.1 | 1143 | 0.768 |
| 25 | South Khorasan | 178 | 0.008226 | 768898 | 231.500147 | 151193 | 1444 | 5.1 | 1021 | 0.757 |
| 26 | North Khorasan | 168 | 0.007764 | 863092 | 194.6490061 | 28434 | 1086 | 30.4 | 831 | 0.745 |
| 27 | Chaharmahal and Bakhtiari | 68 | 0.003143 | 947763 | 71.74789478 | 16328 | 2066 | 58.0 | 383 | 0.798 |
| 28 | Ilam | 183 | 0.008457 | 580158 | 315.4313135 | 20103 | 1427 | 28.9 | 594 | 0.815 |
| 29 | West Azarbaijan | 395 | 0.018255 | 3265219 | 120.9719777 | 37411 | 1363 | 87.3 | 800 | 0.758 |
| 30 | Kohgiluyeh and Boyer-Ahmad | 73 | 0.003374 | 713052 | 102.3768253 | 15504 | 1864 | 46.0 | 611 | 0.791 |
| 31 | Bushehr | 55 | 0.002542 | 1631403 | 33.71331302 | 23198 | 4 | 70.3 | 896 | 0.812 |
*Cumulative Frequency
** ACF= CF/Population *1000000
***Human Development Index
** ACF= CF/Population *1000000
***Human Development Index
Table 2: Results of KMCA in clustering provinces based on the CF and ACF.
| Province | CF | Cluster | Province | ACF | Cluster | ||
| Rank | centroid | Rank | centroid | ||||
| Tehran | 5098 | 1 | 5098 | Qom | 911.56 | 1 | 914.94 |
| Isfahan | 1976 | 2 | 1976 | Semnan | 918.33 | ||
| Mazandaran | 1700 | 3 | 1700 | Markazi | 617.00 | 2 | 626.89 |
| Gilan | 1191 | 4 | 1182 | Yazd | 636.78 | ||
| Qom | 1178 | Mazandaran | 517.73 | 3 | 521.47 | ||
| Alborz | 1177 | Qazvin | 525.21 | ||||
| Markazi | 882 | 5 | 851 | Gilan | 470.62 | 4 | 452.27 |
| Razavi Khorasan | 858 | Alborz | 433.93 | ||||
| East Azarbaijan | 813 | Tehran | 384.46 | 5 | 380.97 | ||
| Yazd | 725 | 6 | 679.66 | Isfahan | 385.87 | ||
| Qazvin | 669 | Zanjan | 372.59 | ||||
| Semnan | 645 | Ilam | 315.43 | 6 | 315.43 | ||
| Golestan | 391 | 7 | 434.16 | Lorestan | 270.35 | 7 | 270.35 |
| Fars | 505 | East Azerbaijan | 207.94 | 8 | 214.16 | ||
| Lorestan | 476 | Golestan | 209.24 | ||||
| Khuzestan | 444 | Ardabil | 227.48 | ||||
| Zanjan | 394 | South Khorasan | 231.50 | ||||
| West Azarbaijan | 395 | North Khorasan | 194.64 | ||||
| Kurdistan | 238 | 8 | 256.66 | Razavi Khorasan | 133.34 | 9 | 112.74 |
| Ardabil | 289 | Kurdistan | 148.47 | ||||
| Hamadan | 243 | Fars | 104.09 | ||||
| Kermanshah | 175 | 9 | 165 | Kermanshah | 89.67 | ||
| Kerman | 169 | Khuzestan | 94.25 | ||||
| Sistan and Baluchestan | 134 | Hamadan | 138.20 | ||||
| Hormozgan | 148 | West Azarbaijan | 120.97 | ||||
| South Khorasan | 178 | Kohgiluyeh and Boyer-Ahmad | 102.37 | ||||
| North Khorasan | 168 | Hormozgan | 83.31 | ||||
| Ilam | 183 | Kerman | 57.50 | 10 | 52.80 | ||
| Chaharmahal and Bakhtiari | 68 | 10 | 65.33 | Sistan and Baluchestan | 48.28 | ||
| Kohgiluyeh and Boyer-Ahmad | 73 | Chaharmahal and Bakhtiari | 71.74 | ||||
| Bushehr | 55 | Bushehr | 33.71 | ||||
*Notably, first clusters show the highest and last clusters show the lowest values of CF/ACF.
.png)
Figure 1: Number of new cases, death and recovered from COVID-19 in Iran, Feb 19 to Mar 2, 2020.
Figure 1: Number of new cases, death and recovered from COVID-19 in Iran, Feb 19 to Mar 2, 2020.
Figure 2: Number of new confirmed cases of COVID -19 in provinces of Iran, Feb 19 to Mar 2, 2020.
Figure 3: Cumulative frequency of new confirmed cases of COVID -19 in provinces of Iran, Feb 19 to Mar 2, 2020
Figure 4: Adjusted cumulative frequency of new confirmed cases of COVID -19 in provinces of Iran,
Feb 19 to Mar 2, 2020.
Figure 5: Number of new cases, Cumulative and death and recovered from COVID 19 per day in Iran, Feb 19 to Mar 2, 2020
Discussion
The Coronavirus has crossed the geographical borders of various countries without any restriction and has caused all countries in the world to confront the challenges of the disease, death of their citizens, economic pressure, and other issues 19. In 2020, Mahmoudi et al. compared distributions of Covid-19 spread in the United States of America, Spain, Italy, Germany, United Kingdom, France, and Iran and clustered those using fuzzy clustering. It was shown that Iran, Italy, Germany, and France are statistically similar 20.
Although figure 2 depicted the daily number of new confirmed cases, there was an upward trend in most provinces. In general, the process of registering new daily cases of the Coronavirus from February 19 to March 22, 2020, in Iran's provinces can be divided into three categories of downward, upward, and irregular. Tehran, Qom, Mazandaran, Golestan, Khorasan Razavi, Khuzestan, and Chaharmahal and Bakhtiari provinces showed a downward trend, Fars, Yazd, Zanjan, Hamedan, Sistan -Baluchistan, and West Azarbaijan showed an upward trend, and other provinces showed an irregular trend. In KMCA as a multivariate technique, each cluster is associated with a centroid, and the aim is to minimize the sum of distances between the points and their respective cluster centroid 21.
In the present study, both CF and ACF were considered points, and each cluster included the provinces with close values. The results of KMCA based on CF of the confirmed cases also pointed out that among six provinces with the highest frequency of infected cases, Tehran, Isfahan, and Mazandaran provinces had an independent trend so that they had specific cluster, but Qom, Gilan, and Alborz had similar trend and common cluster. The results of KMCA based on the ACF of the confirmed cases showed a similar dual trend in the six provinces with the highest frequency.
As it is shown in table 2, KMCA based on CF declared that Tehran province with 13 million population (17.5% of Iran population) which was in the first cluster, had the first rank (maximum CF value) among polluted provinces, while it was not in the category of provinces with high infection (cluster 1) after adjusting CF for the population of each province (ACF). It seems that ACF gives a more realistic description of disease status in each province. According to this adjustment, contrary to the image created by the daily frequency and CF where Tehran, Isfahan, and Markazi provinces were not in good condition, the results of ACF showed that Semnan, Qom, Yazd, Markazi, and Qazvin provinces were in critical condition and needed special attention. Similar to our results in terms of detecting hot spot regions, in 2020, Bazargan and Amirfakhriyan provided spatial clustering of infected cases by Coronavirus from February 22 to March 22, 2020, in provinces of Iran using Exploratory Spatial Data Analysis Approach (ESDA) and detected Tehran, Alborz, Qom, Mazandaran, Gilan, Qazvin, Isfahan, Semnan, Markazi and Yazd provinces as the main spatial propagation centers of this epidemic 22. In 2020, Ramírez-Aldana et al. studied the spatial distribution of COVID-19 in Iran from February 19 to March 18, 2020 to identify areas with higher frequency of infected cases and the factors that affected the disease spread. According to the results of their study, provinces of Qom, Marzaki, Mazandaran, and Semnan in the Northern part of Iran around Tehran, as well as provinces of Alborz, Gilan, Qazvin, and Yazd, were high-risk regions and provinces of Bushehr, Homozgan, Sistan, and Baluschestan were low-risk regions 23. These findings are inconsistent with our study results. Contrary to Ramírez-Aldana et al., which depicted that low COVID-19 confirmed cases were in provinces with more literacy, our findings showed a direct relation between ACF and HDI, which is an indicator of education, life expectancy, and per capita income. The results of the present study also showed a significant negative relationship between the ACF of the confirmed cases in different provinces with distance from Qom, so that the epidemic was more in the provinces with a smaller distance from Qom.This study had some limitations. Due to IMHME policy, provincial data was accessible until March 22, and after that, official data were reported only for the whole country so, obtaining data for each province was not possible.
This limitation did not affect the results of this study, and the classification tool used in this study achieved good results, which can be mentioned as the strength of this study and can also be suggested as a quick tool for classifying and ranking the areas engaged in Covid-19.
Conclusion
In a nutshell, COVID-19, as an infectious and destructive disease, has a considerable transmission speed in Iran. Both CF and ACF can be used to make decisions about disease status in a population, but as this study showed, ACF could give a more realistic and authentic picture of spreading status in each area.
In the present study, KMCA was applied to identify and rank the provinces with similar spreading patterns in terms of the COVID-19 outbreak as it gave good results; this method can be recommended to health policy makers to identify, rank, and separate polluted areas and quarantine them. KMCA results based on ACF recommend that Qom and Semnan provinces need special attention. By the way, these results are limited to study time intervals.
It seems that the outbreak of this infectious disease is more in provinces nearer to the original epicenter. Unexpectedly, provinces with a high level of HDI were more infected. It seems that the joint effect of having high education and more activity may lead to a more dynamic population, and therefore increase the disease transmission rate.
Acknowledgments
This study was approved by the Ethics Committee of Shahid Sadoughi University of Medical Sciences (IR.SSU.SPH.REC.1399.195.)
Funding
The authors received no specific funding for this study.
Conflict of interests
The authors declare that they have no conflict of interest to report regarding the present study.
This is an Open-Access article distributed in accordance with the terms of the Creative Commons Attribution (CC BY 4.0) license, which permits others to distribute, remix, adapt, and build upon this work, for commercial use.
References
- Rothan HA, Byrareddy SN. The epidemiology and pathogenesis of coronavirus disease (COVID-19) outbreak. J Autoimmun. 2020;109: 102433.
- Chen N, Zhou M, Dong X, et al. Epidemiological and clinical characteristics of 99 cases of 2019 novel coronavirus pneumonia in Wuhan, China: a descriptive study. Lancet. 2019;395(10223): 507–13.
- Hsu LY, Chia PY, Lim JFY. The novel coronavirus ( SARS-CoV-2 ) epidemic. Ann Acad Med Singapore. 2020;49:1–3.
- Shereen MA, Khan S, Kazmi A, et al. COVID-19 infection: origin, transmission, and characteristics of human coronaviruses. J Adv Res. 2020; 24:91-8.
- Dehkordi AH, Alizadeh M, Science C, et al. Understanding epidemic data and statistics: A case study of COVID-19. J Med Virology. 2020; 92(7):868-82.
- Chang L, Yan Y, Wang L. Coronavirus disease 2019 : coronaviruses and blood safety. Transfus Med Rev. 2020;34(2):75-80.
- Rahimzadeh G, Ekrami Noghabi M, Kadkhodaei Elyaderani F, et al. COVID-19 infection in iranian children: a case series of 9 patients. J Pediatr Rev. 2020;8(2):139–44.
- Phelan A, Katz R, Gostin L. The novel coronavirus originating in Wuhan ,China challenges for global health governance. JAMA. 2020;323(8):709–10.
- Sohrabi C, Alsafi Z, Neill NO, et al. World health organization declares global emergency : a review of the 2019 novel coronavirus (COVID-19). Int J Surg. 2020;76:71-6.
- CDC. Who are at higher risk for severe illness [Internet]. Available from: https://www. cdc. gov/ coronavirus/ 2019-ncov/specific-groups/ high- risk- complications. html. [Cited 15 September 2020]
- Cunningham AC, Goh HP, Koh D. Treatment of COVID‐19: old tricks for new challenges. Crit Care. 2020;24(1):91.
- Wilson ME, Chen LH. Travelers give wings to novel coronavirus (2019-nCoV). J Travel Med. 2020;27(2):15.
- Worldmapper. Covid-19 (Coronavirus) Update: Chronology of a Pandemic. Available from: https:// worldmapper. org/ covid-19-coronavirus. [Cited 09 December 2020]
- Imtyaz A, Haleem A, Javaid M. Analysing governmental response to the COVID-19 pandemic. J Oral Biol Craniofacial Res. 2020;10(4):504–13.
- Mahmudan A. Clustering of district or city in central java based COVID-19 case using k-means clustering. Jurnal Matematika, Statistika dan Komputasi. 2020;17(1):1–13.
- Doroshenko A. Analysis of the distribution of COVID-19 in italy using clustering algorithms. IEEE Third International Conference on Data Stream Mining & Processing (DSMP). Lviv, Ukraine. 21-25 Aug, 2020.
- Arpaci I, Alshehabi S, Al-emran M, et al. Analysis of twitter data using evolutionary clustering during the COVID-19 pandemic. CMC-Computers Materials & Continua. 2020;65(1):193-203.
- Maugeri A, Barchitta M. A clustering approach to classify italian regions and provinces based on prevalence and trend of SARS-CoV-2 cases. Int J Environ Res Public Health. 2020;17:5286.
- Saghazadeh A, Rezaei N. Immune-epidemiological parameters of the novel coronavirus–a perspective. Expert Rev Clin Immunol. 2020;16(5):465-70.
- Science N, Phenomena C, Reza M, et al. Fuzzy clustering method to compare the spread rate of Covid-19 in the high risks countries. Chaos Soliton Fract. 2020;140:1–9.
- Dunn H, Quinn L, Corbridge S, et al. Cluster analysis in nursing research: an introduction, historical perspective, and future directions. West J Nurs Res. 2018;40(11):1658–76.
- Bazargan M, Amirfakhriyan M. Geographical analysis of COVID-19 epidemiology in Iran with exploratory spatial data analysis approach (ESDA). Journal Mil Med. 2020;22(6):542–52.
- Ramírez-aldana R, Gomez-verjan JC, Bello- OY. Spatial analysis of COVID-19 spread in Iran : Insights into geographical and structural transmission determinants at a province level. medRxiv. 2020;14(11):e0008875.
Type of Study: Original articles |
Subject:
Biostatistics
Received: 2020/11/12 | Accepted: 2021/01/20 | Published: 2021/03/15
Received: 2020/11/12 | Accepted: 2021/01/20 | Published: 2021/03/15
Send email to the article author
| Rights and permissions | |
 |
This work is licensed under a Creative Commons Attribution-NonCommercial 4.0 International License. |
