

Volume 5, Issue 2 (June 2020)
J Environ Health Sustain Dev 2020, 5(2): 1016-1020 |
Back to browse issues page


Download citation:
BibTeX | RIS | EndNote | Medlars | ProCite | Reference Manager | RefWorks
Send citation to:


BibTeX | RIS | EndNote | Medlars | ProCite | Reference Manager | RefWorks
Send citation to:
Fallahzadeh R A, Ghadirian D, Eshaghpanah M S, Shukohifar M, Mozafari S, Targhibi A R et al . The Relationship between Ambient Temperature and Positive Cases of COVID-19; A Case Study in Abarkouh and Qeshm Cities of Iran. J Environ Health Sustain Dev 2020; 5 (2) :1016-1020
URL: http://jehsd.ssu.ac.ir/article-1-235-en.html
URL: http://jehsd.ssu.ac.ir/article-1-235-en.html
Reza Ali Fallahzadeh 

 , Davoud Ghadirian , Mohammad Sadegh Eshaghpanah , Marzieh Shukohifar , Safiyeh Mozafari , Ali Reza Targhibi , Fariborz Omidi *
, Davoud Ghadirian , Mohammad Sadegh Eshaghpanah , Marzieh Shukohifar , Safiyeh Mozafari , Ali Reza Targhibi , Fariborz Omidi *
Research Center for Environmental Determinants of Health (RCEDH), Health Institute, Kermanshah University of Medical Sciences, Kermanshah, Iran.
Full-Text [PDF 581 kb]
(678 Downloads)
| Abstract (HTML) (1789 Views)
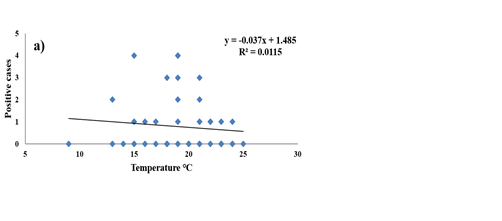
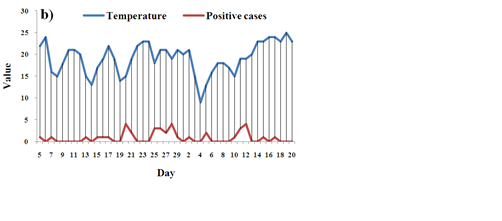
Figure 1: a) Correlation between temperature and the number of positive cases (correlation; -0.107 and p-value; 0.46), b) Correlation between the number of positive cases and the daily temperature during the study period in Abarkouh City
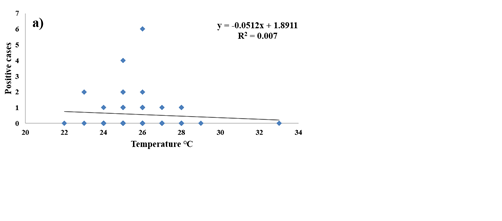
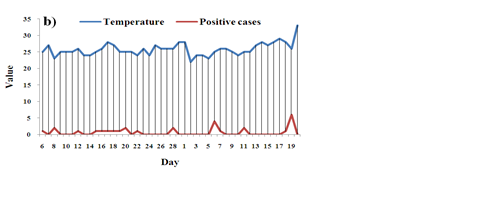
Figure 2: a) Correlation between temperature and number of positive cases (correlation; -0.083 and p-value; 0.57) b) Correlation between the number of positive cases and daily temperature during the study period in Qeshm City
Full-Text: (506 Views)
The Relationship between Ambient Temperature and Positive Cases of COVID-19; A Case Study in Abarkouh and Qeshm Cities of Iran
Reza Ali Fallahzadeh 1,2, Davoud Ghadirian 2, Mohammad Sadegh Eshaghpanah 2, Marzieh Shukohifar2, Safiyeh Mozafari 3, Ali Reza Targhibi 4, Fariborz Omidi 5*
1 Environmental Science and Technology Research Center, Department of Environmental Health Engineering, Shahid Sadoughi University of Medical Sciences, Yazd, Iran.
2 Genetic and Environmental Adventures Research Center, School of Abarkouh Paramedicine, Shahid Sadoughi University of Medical Sciences, Yazd, Iran.
3 Department of Environmental Health, Payambar Azam Qeshm Hospital, Hormozgan University of Medical Sciences, Bandar Abbas, Iran.
4 Health Office of Qeshm, Hormozgan University of Medical Sciences, Bandar Abbas, Iran.
5 Research Center for Environmental Determinants of Health (RCEDH), Health Institute, Kermanshah University of Medical Sciences, Kermanshah, Iran.
| A R T I C L E I N F O | ABSTRACT | |
| ORIGINAL ARTICLE | Introduction: The prevalence of infectious diseases varies depending on the type of micro-organism involved. Viral diseases can spread rapidly among communities, due to the specific characteristics of the virus. Coronavirus disease 2019 (COVID 19) is a new member of the coronavirus family that has caused rapid epidemics and affected the health and economy of the countries. The aim of this study was to investigate the relationship between the ambient temperature and the positive cases of COVID 19. Materials and Methods: In the present research, the relationship between the number of positive cases of COVID 19 and the ambient temperature was investigated in Abarkouh and Qeshm cities during a 49-day period. The collected data were analyzed by SPSS 16 software using descriptive statistics and correlation coefficient tests. Results: The average ambient temperatures in the study period were 19.16 ± 3.45 and 25.79 ± 1.83 for Abarkouh and Qeshm cities, respectively. During this period, the positive cases in Abarkouh and Qeshm cities were 38 and 28 people, respectively. The results of correlation test revealed a negative correlation between the ambient temperature and the number of patients with COVID 19 (the correlation rates were -0.107 and -0.083 with p-values of 0.46 and 0.57 for Abarkouh and Qeshm, respectively). Conclusion: Our results revealed that increase of air temperature was negatively correlated with the number of positive cases of COVID 19. It can be concluded that atmospheric temperature affects the virus outbreak. So, the rate of virus spread is expected to be reduced. |
|
| Article History: Received: 13 February 2020 Accepted: 20 April 2020 |
||
| *Corresponding Author: Fariborz Omidi Email: omidifariborz@yahoo.com Tel: +989128360892 |
||
| Keywords: COVID 19, Particular Matter, Communicable Disease, Environment. |
Citation: Fallahzadeh RA, Ghadirian D, Eshaghpanah MS, et al. The Relationship between Ambient Temperature and Positive Cases of COVID-19; A Case Study in Abarkouh and Qeshm Cities of Iran. J Environ Health Sustain Dev. 2020; 5(2): 1016-20.
Introduction
Viruses are a major cause of acute and chronic illnesses in human beings. They are common pathogens in hospital environments, health care services, and in crowded places with poor hygiene such as schools and kindergartens1-3. Most viral infections are subclinical and asymptomatic; however, mild viral illnesses can put a heavy burden on the economy and health care systems4. The mild viral illnesses are an important predisposing factor for more serious and perhaps secondary fatal bacterial infections 5.Viral infections cause 60% of the human infections, most of which are caused by respiratory and intestinal viruses 6, 7. Annually, 1.7 million deaths are reported from diarrhea diseases and 1.5 million deaths are caused by respiratory infections worldwide 8. Several factors can affect environmental pollutants 9 and spread of viral infections that include unsanitary conditions, susceptible host, population congestion, high infectivity of viruses even at low doses, as well as excretion of viruses from the infected person before the onset of symptoms until several days after recovery 10. In December 2019, the main outbreak center of Coronavirus disease 2019 (COVID 19) (SARS CoV-2) was Wuhan, Hubei province 11. The virus began to spread rapidly among countries, with a much higher prevalence than severe acute respiratory syndrome (SARS) 11. The global prevalence of COVID 19 has created many barriers to public health and the global economy 12. To control the prevalence of COVID 19, biological characteristics of the virus should be investigated in the natural environment, especially in the outbreak time. Temperature is an important factor influencing the survival of micro- and macro-organisms that can play an important role in the spread and control of epidemics 13. The viability of micro-organisms varies in different environments and temperatures 10. Temperature and humidity of the environment are effective factors on the outbreak of COVID19. At the beginning of the outbreak, countries with lower temperatures and humidity (such as Korea, Japan, and Iran) had a higher prevalence rate than warmer countries with high humidity (such as Singapore, Malaysia, and Thailand) 14. Based on previous studies, at the time of SARS outbreak in 2003, the number of infected people in areas with low temperatures was 18.18 times higher than those who lived in areas with higher temperatures 15.
The aim of this study was to investigate the positive cases of COVID19 and its correlation with the ambient temperature in two cities of Abarkuh and Qeshm with different average temperatures in a 49-day period.
Materials and Methods
This descriptive-analytical study was carried out in two cities of Abarkouh and Qeshm with a population of 51199 and 45178, respectively. To conduct the study, the number of positive cases (confirmed by a testing kit and CT scan) and the air temperature were examined from February 20th to April 8th. The relationship between the number of positive cases and the ambient temperature was analyzed using descriptive statistics and correlation coefficient tests by SPSS (version16.0.).
Results
During the studied period, the average ambient temperature for Abarkouh and Qeshm cities were 19.16 ± 3.45℃ and 25.79 ± 1.83 ℃, respectively. Moreover, the number of positive cases were 38 and 28 in Abarkouh and Qeshm, respectively (Table 1).
Table 1: The ambient temperature, the number of definite cases, and the correlation test during the study period
| P-value | Correlation | Positive cases |
Std. deviation |
Mean temperature |
Maximum temperature |
Minimum temperature | Days | Location |
| 0.46 | -0.107 | 38 | 3.45 | 19.16 | 25.00 | 9.00 | 49 | Abarkouh |
| 0.57 | -0.083 | 28 | 1.83 | 25.79 | 33.00 | 22.00 | 49 | Qeshm |
With regard to Abarkouh City, statistical analysis showed that the correlation between ambient temperature and number of positive cases was determined as -0.107. Furthermore, the rate of determination was 0.011, which indicates that 1.1% of the changes in the dependent variable (the numbers of positive cases) can be expressed by the ambient temperature. Figure 1a illustrates the correlation between temperature and the number of positive cases. The correlation between the number of positive cases and the daily temperature is represented in Figure 1b.
Figure 1: a) Correlation between temperature and the number of positive cases (correlation; -0.107 and p-value; 0.46), b) Correlation between the number of positive cases and the daily temperature during the study period in Abarkouh City
Considering Qeshm, statistical analysis
revealed that the correlation between the ambient temperature and the positive cases was -0.083 and the rate of determination was 0.007. In other words, 0.07 percent of the dependent variable
(the number of positive cases) is expressed by
the ambient temperature. Figure 2a illustrates
the correlation between temperature and the number of positive cases. Figure 2b shows the correlation between the number of positive
cases and the daily temperature during the study period.
Figure 2: a) Correlation between temperature and number of positive cases (correlation; -0.083 and p-value; 0.57) b) Correlation between the number of positive cases and daily temperature during the study period in Qeshm City
Discussion
According to the findings, the ambient temperature of Abarkouh City had higher thermal turbulence compared to Qeshm City in the study period; the ambient temperature varied from 9 to 25 ºC with an average of 19.16 ± 3.45 ºC in Abarkouh City. The city of Qeshm had lower thermal turbulence with a high average temperature of 25.79 ± 1.83. The comparison of the number of positive cases between these two cities revealed that the percentage of positive cases in Qeshm was 15% lower than that of Abarkouh. Results of the correlation test between temperature and the number of positive cases in the studied cities showed that the number of positive cases decreased by increase of temperature (Figures 1a and 2a). The correlation between temperature and the number of positive cases was more obvious in Abarkouh due to higher thermal turbulence. The daily temperature comparison chart and the number of positive cases (Figures 1b and 2b) also indicate an increase in the definite number of COVID 19 cases when the average temperature decreases. According to previous studies, high temperature and humidity reduce the rate of transmission and spread of influenza 16-18, which can be justified by the following justifications. First, influenza is more stable at low temperatures and humidity 19, 20 and second, wet and cold weather can weaken the host's immune system and make the person more vulnerable to the virus 21, 22. Moreover, the literature indicated that increase of the ambient temperature and humidity reduced the viability of SARS coronavirus 23, 24. In addition to the epidemiological studies, laboratory studies have also confirmed this finding 18, 25-27. Moreover, infectivity of the virus increases under low temperature and humidity conditions. The results of a study on swine flu revealed that the infection rate at a temperature of 5 ºC and humidity of 35-50 % was in the range of 75 to 100%. However, with an increase of temperature to 30 ºC and humidity to 35%, the infectious rate was zero 28. Another study found that three key factors of temperature, humidity, and wind speed were effective in the spread of SARS virus 24. A laboratory study of the SARS virus reported that the virus could remain active on smooth surfaces for at least 5 days at the temperature of 22 to 25 ºC with the humidity of 40 to 50%. In the case that the temperature elevated to 38 ºC and the relative humidity increased to 95%, the virus lost its activity quickly 23. Another study published in 2013 found that Middle East Respiratory Syndrome virus remained active for a long time under low temperature and humidity conditions 29. Wang et al. also investigated the effect of high temperature and humidity. Based on their results, high temperature and humidity reduced the transmission of COVID-19 14.
Conclusion
The correlation between the number of positive cases of COVID 19 and temperature was investigated in Abarkouh and Qeshm cities during a 49-day period. Based on the findings, the number of positive cases were decreased by increase of the ambient temperature in both cities. In Abarkouh, the relationship between the number of positive cases and the air temperature was more obvious due to the higher thermal turbulence. A significant decrease is expected in the number of positive cases in the coming days and months due to the increase of ambient air temperature, which is unfavorable for the virus survival.
Acknowledgements
The authors would like to thank the Genetic and Environmental Adventures Research Center of Shahid Sadoughi University of Medical Sciences for technical support.
Funding
This study was funded by the Genetic and Environmental Adventures Research Center in Shahid Sadoughi University of Medical Sciences, Yazd.
Conflict of interest
No conflict of interest was stated by the authors.
This is an Open-Access article distributed in accordance with the terms of the Creative Commons Attribution (CC BY 4.0) license, which permits others to distribute, remix, adapt, and build upon this work, for commercial use.
References
1. Aitken C, Jeffries DJ. Nosocomial spread of viral disease. Clin Microbiol Rev. 2001;14(3):528-46.
2. Meakins S, Adak G, Lopman B, et al. General outbreaks of infectious intestinal disease (IID) in hospitals, England and Wales, 1992–2000. J Hosp Infect. 2003;53(1):1-5.
3. Strausbaugh LJ, Sukumar SR, Joseph CL, et al. Infectious disease outbreaks in nursing homes: an unappreciated hazard for frail elderly persons. Clinical Infectious Diseases. 2003;36(7):870-6.
4. Sartor C, Zandotti C, Romain F, et al. Disruption of services in an internal medicine unit due to a nosocomial influenza outbreak. Infect Control Hosp Epidemiol. 2002;23(10):615-9.
5. Hament JM, Kimpen JL, Fleer A, et al. Respiratory viral infection predisposing for bacterial disease: a concise review. FEMS Immunol Med Microbiol. 1999;26(3-4):189-95.
6. Barker J, Stevens D, Bloomfield S. Spread and prevention of some common viral infections in community facilities and domestic homes. J Appl Microbiol. 2001;91(1):7-21.
7. McElhaney JE. Influenza vaccine responses in older adults. Ageing Res Rev. 2011;10(3):379-88.
8. Osseiran N, Hartl G. WHO Almost a quarter of all disease caused by environmental exposure. World Health Organization Accessed. 2012;11.
9. Omidi F, Dehghani F, Fallahzadeh RA, et al. Probabilistic risk assessment of occupational exposure to volatile organic compounds in the rendering plant of a poultry slaughterhouse. Ecotoxicol Environ Saf. 2019;176(2019): 132-6.
10. Sattar S. Microbicides and the environmental control of nosocomial viral infections. J Hosp Infect. 2004;56:64-9.
11. Wu F, Zhao S, Yu B, et al. A new coronavirus associated with human respiratory disease in China. Nature. 2020;579(7798):265-9.
12. Wooldridge JM. Introductory Econometrics a modern approach 3rd edition. Cincinnati: South-Western College Pub. 2005.
13. Wolkoff P. Indoor air humidity, air quality, and health–An overview. Int J Hyg Environ Health. 2018;221(3):376-90.
14. Tosepu R, Gunawan J, Effendy DS, et al. Correlation between weather and Covid-19 pandemic in Jakarta, Indonesia. Sci Total Environ 2020;725:138436.
15. Tan J, Mu L, Huang J, et al. An initial investigation of the association between the SARS outbreak and weather: with the view of the environmental temperature and its variation. J Epidemiol Community Health. 2005;59(3):186-92.
16. Lowen AC, Steel J, Mubareka S, et al. High temperature (30 C) blocks aerosol but not contact transmission of influenza virus. J Virol. 2008;82(11):5650-2.
17. Park JE, Son WS, Ryu Y, et al. Effects of temperature, humidity, and diurnal temperature range on influenza incidence in a temperate region. Influenza Other Respir Viruses. 2020; 14(1): 11-8.
18. Shaman J, Kohn M. Absolute humidity modulates influenza survival, transmission, and seasonality. Proc Natl Acad Sci. 2009;106(9): 3243-8.
19. Lowen AC, Steel J. Roles of humidity and temperature in shaping influenza seasonality. J Virol. 2014;88(14):7692-5.
20. Tellier R. Aerosol transmission of influenza a virus: a review of new studies. J R Soc Interface. 2009;6(6):783-90.
21. Eccles R. An explanation for the seasonality of acute upper respiratory tract viral infections. Acta Otolaryngol. 2002;122(2):183-91.
22. Kudo E, Song E, Yockey LJ, et al. Low ambient humidity impairs barrier function and innate resistance against influenza infection. Proc Natl Acad Sci. 2019;116(22):10905-10.
23. Chan K, Peiris J, Lam S, et al. The effects of temperature and relative humidity on the viability of the SARS coronavirus. Adv Virol. 2011;2011: 734690.
24. Yuan J, Yun H, Lan W, et al. A climatologic investigation of the SARS-CoV outbreak in Beijing, China. Am J Infect Control. 2006;34(4):234-6.
25. Lipsitch M, Viboud C. Influenza seasonality: lifting the fog. Proc Natl Acad Sci. 2009;106(10):3645-6.
26. Steel J, Palese P, Lowen AC. Transmission of a 2009 pandemic influenza virus shows a sensitivity to temperature and humidity similar to that of an H3N2 seasonal strain. J Virol. 2011;85(3):1400-2.
27. Dalziel BD, Kissler S, Gog JR, et al. Urbanization and humidity shape the intensity of influenza epidemics in US cities. Science. 2018;362(6410):75-9.
28. Lowen AC, Mubareka S, Steel J, et al. Influenza virus transmission is dependent on relative humidity and temperature. PLoS Pathog. 2007;3(10):1470-7.
29. Van Doremalen N, Bushmaker T, Munster V. Stability of Middle East respiratory syndrome coronavirus (MERS-CoV) under different environmental conditions. Eurosurveillance. 2013; 18 (38):20590-4.
Type of Study: Original articles |
Subject:
Environmental Health, Sciences, and Engineering
Received: 2020/02/13 | Accepted: 2020/04/20 | Published: 2020/06/27
Received: 2020/02/13 | Accepted: 2020/04/20 | Published: 2020/06/27
Send email to the article author
| Rights and permissions | |
 |
This work is licensed under a Creative Commons Attribution-NonCommercial 4.0 International License. |
