

Volume 4, Issue 1 (March 2019)
J Environ Health Sustain Dev 2019, 4(1): 670-677 |
Back to browse issues page


Download citation:
BibTeX | RIS | EndNote | Medlars | ProCite | Reference Manager | RefWorks
Send citation to:


BibTeX | RIS | EndNote | Medlars | ProCite | Reference Manager | RefWorks
Send citation to:
Magna E K, Dabi M, Tadri P. Spatial Distribution of Malaria in the Semi-Arid Zone of Ghana: A Case of Upper West Region Using GIS Approach. J Environ Health Sustain Dev 2019; 4 (1) :670-677
URL: http://jehsd.ssu.ac.ir/article-1-160-en.html
URL: http://jehsd.ssu.ac.ir/article-1-160-en.html


Institute for Environment and Sanitation Studies, Faculty of Basic and Applied Science, University of Ghana, P.O. Box 209, Legon-Accra, Ghana.
Full-Text [PDF 630 kb]
(831 Downloads)
| Abstract (HTML) (2638 Views)
Table 1: Malaria incidence in the Upper west region in 2010-2016
References
Full-Text: (673 Views)
Spatial Distribution of Malaria in the Semi-Arid Zone of Ghana: A Case of Upper West Region Using GIS Approach
Emmanuel Kaboja Magna 1*, Michael Dabi 2, Peter Tadri 3
1 Institute for Environment and Sanitation Studies, Faculty of Basic and Applied Science, University of Ghana, P.O. Box 209, Legon-Accra, Ghana.
2 E. P. University College, P. O. Box HP 678, Ho, VR, Ghana.
3 University of Ghana School of Business, P. O. Box LG 78, Legon –Accra, Ghana.
| A R T I C L E I N F O | ABSTRACT | |
| ORIGINAL ARTICLE | Introduction: Malaria is the leading cause of mortality and morbidity in Ghana. However, we are faced with lack of reliable data on the spatial distribution for effective control measures in the semi-arid zones of Ghana. This study aimed at mapping and describing the transmission patterns of malaria to identify the high risk zones in the Upper west region of Ghana. Materials and Methods: We mapped the 7-years malaria data regarding all districts using a GPS. The mapping technique employed the graduated colour maps, with natural break classification method. Thematic map generated in ArcView was overlaid on a vegetation map of the region. Results: The maps showed spatial distribution of malaria in the region: Wa municipality had the highest incidence of the disease (21.72%), whereas, Daffiama-Bussie had the lowest rate (4.24%) during the study. The study also showed a very high malaria incidence (1.481001-1.910000) per 10000 in the Wa municipality, Nandowli-kaleo, and the Nandom districts. Over the period, the highest incidence was recorded within the grassland with scattered trees and widely cultivated areas of Savanna woodlands. Conclusion: Community health education, improvement of public health, interventions using the mass distribution of mosquitoes treated nets, and integrated vector control are recommended. |
|
| Article History: Received:25 November 2018 Accepted: 20 January 2019 |
||
| *Corresponding Author: Emmanuel Kaboja Magna Email: egmagna@yahoo.co.uk Tel: +233557364486 |
||
| Keywords: Plasmodium falciparum, prevention and control, Drug Resistance, Epidemics. |
Introduction
Malaria is a climate-sensitive protozoan disease caused by parasites of Plasmodium genus, which is transmitted among humans through bites of infected female Anopheles mosquitoes 1, 2, 3. The term malaria originated from the medieval Italian term “mala aria” which means “bad air”. The disease was formerly called ague or marsh fever due to its association with swamp and marsh land 4. There are five different types of parasites that infect humans: P. falciparum, P. vivax, P. ovale, and P. malariae of which P. falciparum and P. vivax 5, 6. An estimated 3.2 billion people are at risk of malaria world-wide resulting in 438,000 deaths annually 7. Malaria is hyper-endemic with a crude parasite rate of 10–70 percent and Plasmodium falciparum is the most highly virulent type responsible for almost all of 1.7-2.5 million deaths worldwide 8. In a non-immune individual, symptoms usually appear 10–15 days after the infective mosquito's bite and may include fever, headache, chills, vomiting, severe anemia, and cerebral malaria 6. In December 2016, WHO reported that about 212 million cases of malaria and 429,000 cases of deaths were caused by malaria in 2015 9. The most endemic area has been the Sub-Saharan Africa sub- region; 85-90 percent of the world’s deaths occur in this region. According to World Malaria Report 2016, malaria financing totalled US$ 2.9 billion in 2015 and is even estimated to increase substantially to US$ 6.4 billion if the Global Technical Strategy for Malaria 2016–2030 milestone is to be attained by 202010.
Malaria is the leading cause of morbidity and mortality in Ghana and is reported to be responsible for over one third of all outpatient cases noted each year. In this regard, 20 to 30 percent of deaths in children younger than five years of age and 11 percent of maternal deaths were reported 11. According to the Ministry of Health, it is estimated that 10.6 percent of the loss of Disability Adjusted Life Years (DALYs) in Ghana are due to malaria, which cost about 6 percent of GDP annually in economic burden 12. Agriculture is the bedrock of Ghana’s economy, but the formal and informal sectors suffer loss of labor forces and products due to malaria illness 13. The situation affects school attendance of children and formal workers who lose a lot of their working hours as a result of malaria infections.
Although it has become the major public health issue in Ghana, the economic burden of the rural and urban folks caused by this disease cannot be estimated. Most people in the rural communities live in unplanned settlements with inappropriate waste generation and disposal systems. This in turn, results in poor and choked drainage systems and creates numerous places for mosquitoes to breed. Climate change and variability have exacerbated these environmental conditions, heavy rainfalls and increasing temperatures further supported mosquito breeding and malaria prevalence 14. Other environmental factors such as the presence of bushes and stagnant water around homes, low altitude, and high temperatures are favorable for the breeding of malaria vectors as well as parasite reproduction within them 15. Climate change may also cause floods that may leave pockets of water, which will serve as suitable breeding grounds for mosquitoes and other water related diseases. Reduction in man-vector contact may be achieved by application of protective clothing, insect repellents, bed nets, insecticides or environmental management 16.
The effect of malaria interventions across the varied epidemiological settings of Africa remained poorly understood owing to the absence of reliable research on the disease pattern. The National Malaria Control Program (NMCP) and the Ghana Health Service have focused on identifying the strategies to achieve relatively high coverage of malaria interventions including distribution of Long-Lasting Insecticidal Nets (LLINs), Indoor residual spraying (IRS), and Intermittent Preventive Treatment in pregnancy (IPTp) coverage. Despite these efforts to completely control the disease, malaria has remained the leading cause of mortality and morbidity in Ghana.
According to a study 17, SMC intervention was piloted in Ghana from July to October 2015 with a trial in the Upper West Region, because it had the highest prevalence of malaria in the country, i.e., 37.8 percent. To mitigate this problem, a number of measures have been taken by the non-governmental organizations (NGOs) and the Ministry of Health to eradicate malaria to attain Sustainable Development Goal three (SDG 3) by 2030 in Ghana. Therefore, a systematic study was carried out to assess the knowledge, attitudes, and practices of people in malaria endemic communities in the northern part of Ghana 18. Meanwhile, the insecticide treated nets have proven to be the best option for malaria prevention. In a study 19, it was reported that due to socio-economic reasons, the ITNs are put into other uses such as nursing of seedlings, protecting chickens, fishing, and fencing of animal pens in the northern regions. However, with all these control measures, malaria has remained the leading cause of morbidity and mortality. It was also responsible for the large burden on the country’s health system 20.
Despite the efforts made by the government of Ghana in the semi-arid zones, characterized by its poor rainfall nature, the Upper West Region is still among the poorest and weakest areas in terms of malaria burden 21. Available statistics shows that the region recorded the highest number of malaria cases of about 51 per cent among children aged six to 59 months and the highest case fatality rate of about 0.69% in the 1st quarter of 2016 22, 23, 20 affirms that the poor are the most affected because of the socio-economic constraints they are faced with, which together with culture and traditions affect the way people perceive the disease regarding its cause and possible treatment. The disease has induced huge economic losses due to ebbed productivity of victims to the tune of hundreds of millions of Dollars, intense morbidity due to chronic disfigurements as well as social stigma on patients.
Malaria mapping is centered on the fact that malaria vector is distributed unevenly both within and between places and therefore exhibits spatial variation 24. The degree of malaria infestation in the upper west region varies from district to district and even from places to places. In Ghana, the non-existence of extensive spatial malaria maps makes it difficult to optimize the scarce resources in achieving targets during the control programs 25. This spatial attribute of malaria infestation across the districts necessitates the need for assessment regarding the changes of malaria transmission, identification of malaria epidemics' areas, and periods with a higher risk using different scales 26. The spatial mapping will assist in the public health planning and provides timely answers to a diverse range of questions related to the key goals of efficiency, effectiveness, and equity in terms of the provision of services 27. Considering the various factors that influence transmission of vector-borne diseases such as malaria, which include environmental and geographical indices and the need to generate useful data on the disease distribution, we targeted at mapping and describing the transmission pattern of malaria in order to identify the high-risk zones of the infection in Upper west region of Ghana, which lies in the semi-arid zone.
Materials and Methods
Profile of the study area
The study was conducted in the Upper west region located in the northwestern corner of Ghana with Wa as its regional capital. Wa is the smallest region in Ghana and covers a geographical area of 18,476 sq.km representing 12.7 percent of the total land area of Ghana. The region is located between latitude 9.8°-11.0°N and longitude 1.6°-3.0° W. Majority of the economically active group work in peasant farming agriculture. The region is located on the guinea savannah vegetation belt. The vegetation consists of grass with scattered drought resistant trees such as the Shea, the Baobab, Dawadawa, and Neem trees. The heterogeneous collection of trees provides all domestic requirements for fuel wood and charcoal, construction of houses, cattle kraals, and fencing of gardens. The shorter shrubs and grass provide fodder for livestock.
The region experiences two climatic seasons: the dry and the wet seasons. The wet season commences from early April and ends in October. The dry season, characterized by the cold and hazy harmattan weather, starts from early November and ends in the latter part of March when the hot weather begins with intensity; this is actually the time of the onset of the early rainfall in April. The minimum temperature of the region is 15℃ at night during the harmattan season, while the maximum temperature is 40℃ in the day during the hot season.
Upper west region has eleven administrative districts with a total population of 576,583, which contains 47.9 percent of male and 52.1 percent of female individuals. The region has ten hospitals, 60 health centers, one health post and three maternity homes. Wa municipality has the highest proportion of the health facilities with about 32.4 percent, while the other health centers are fairly distributed among the other districts. The major malaria transmission pattern in the Upper west is between 6 to 7 months, with the highest number (50–60 %) of cases occurring in July to November 16.
Data collection and analysis
The monthly malaria cases in each district of the upper west region for the seven years period (2010-2016) were obtained from the Upper West Regional Health Directorate. The yearly malaria cases for each of the administrative district were calculated. Projected population for the years 2010-2016 obtained from Ghana Statistical Service was also used for the computation of the malaria incidence. To obtain the incidence rate over the years of study, the average population was computed for each administrative district.
The Shape Thematic Map of the 11 local administrative districts of Upper West Region were created usingGIS from the Geometric department of KNUST. Thematic mapping was applied to display the spatial variation according to the districts' area and to present a visual display of seasonal variation in malaria incidence. Thematic maps were created in Arc view GIS version 3.1 (ESRI). Mapping was based on the incidence rate of malaria of the 7- year period (2010-2016). Later, we entered the data of the reported malaria cases and administrative district population into the MS Excel (Version 2010) and linked them to the Arc view. In this process, we aggregated the data based on months and seasons. Furthermore, we displayed the analyzed information at the districts' spatial levels. The mapping technique used was the graduated colour map using the natural break classification method. This enabled the modeling of spatial patterns of malaria incidence and classified the observed malaria incidence under four case levels of very low, low, high, and very high with natural break ranges for each case level.
Ethical issues
A special malaria data requisition letter was written to the Regional Health Directorate in the Upper West region of Ghana. Cognizance of the privacy, confidentiality, and anonymity right of the research participants was greatly considered by the researchers during the extraction of the data from the database. So, participants' names were not included in the extraction data.
Results
Malaria profile in Upper West
Within the seven-year period of study, a total of about 6,179,171 cases of malaria were reported in the upper west region; with incidence rate of 14.64 cases per 10000 population. The results showed that Wa municipality had the highest number of malaria reported cases (n = 1342286 (21.72%)); whereas, Daffiama-Bussie district had the lowest rate (n = 261847 (4.24%)).
The thematic map in figures 1, 2 shows the malaria incidence rate per 10000 populations for each of the districts of the Upper West region of Ghana. Out of the 11 districts only three (i.e. Wa, Nandowli-Kaleo, and Nandom) had an average incidence rate in the range of 1.48-1.98 per 10000 population. Only Wa east district had an average incidence rate of 0.637-0.895 per 10000 population. The highest annual rate of malaria incidence over the study period was recorded as 1086175 cases (17.58%) in 2013 within a total population of 744821. The lowest reported annual incidence rate of malaria was in 2010 with 587024 (9.50%) out of a population of 702114. The related information is shown in Table 1.
Seasonal incidence rate of malaria
The highest proportion of the malarial cases was reported in the wet season: between April and October (n = 3804583, 61.57%). The number of malaria cases in the dry season, that is between November and March was 38.43 percent. We found that over the period of study, the highest rate for the disease cases was reported in October, i.e., 11.19 percent, whiles the lowest number was recorder in April (6.45%).
Malaria is a climate-sensitive protozoan disease caused by parasites of Plasmodium genus, which is transmitted among humans through bites of infected female Anopheles mosquitoes 1, 2, 3. The term malaria originated from the medieval Italian term “mala aria” which means “bad air”. The disease was formerly called ague or marsh fever due to its association with swamp and marsh land 4. There are five different types of parasites that infect humans: P. falciparum, P. vivax, P. ovale, and P. malariae of which P. falciparum and P. vivax 5, 6. An estimated 3.2 billion people are at risk of malaria world-wide resulting in 438,000 deaths annually 7. Malaria is hyper-endemic with a crude parasite rate of 10–70 percent and Plasmodium falciparum is the most highly virulent type responsible for almost all of 1.7-2.5 million deaths worldwide 8. In a non-immune individual, symptoms usually appear 10–15 days after the infective mosquito's bite and may include fever, headache, chills, vomiting, severe anemia, and cerebral malaria 6. In December 2016, WHO reported that about 212 million cases of malaria and 429,000 cases of deaths were caused by malaria in 2015 9. The most endemic area has been the Sub-Saharan Africa sub- region; 85-90 percent of the world’s deaths occur in this region. According to World Malaria Report 2016, malaria financing totalled US$ 2.9 billion in 2015 and is even estimated to increase substantially to US$ 6.4 billion if the Global Technical Strategy for Malaria 2016–2030 milestone is to be attained by 202010.
Malaria is the leading cause of morbidity and mortality in Ghana and is reported to be responsible for over one third of all outpatient cases noted each year. In this regard, 20 to 30 percent of deaths in children younger than five years of age and 11 percent of maternal deaths were reported 11. According to the Ministry of Health, it is estimated that 10.6 percent of the loss of Disability Adjusted Life Years (DALYs) in Ghana are due to malaria, which cost about 6 percent of GDP annually in economic burden 12. Agriculture is the bedrock of Ghana’s economy, but the formal and informal sectors suffer loss of labor forces and products due to malaria illness 13. The situation affects school attendance of children and formal workers who lose a lot of their working hours as a result of malaria infections.
Although it has become the major public health issue in Ghana, the economic burden of the rural and urban folks caused by this disease cannot be estimated. Most people in the rural communities live in unplanned settlements with inappropriate waste generation and disposal systems. This in turn, results in poor and choked drainage systems and creates numerous places for mosquitoes to breed. Climate change and variability have exacerbated these environmental conditions, heavy rainfalls and increasing temperatures further supported mosquito breeding and malaria prevalence 14. Other environmental factors such as the presence of bushes and stagnant water around homes, low altitude, and high temperatures are favorable for the breeding of malaria vectors as well as parasite reproduction within them 15. Climate change may also cause floods that may leave pockets of water, which will serve as suitable breeding grounds for mosquitoes and other water related diseases. Reduction in man-vector contact may be achieved by application of protective clothing, insect repellents, bed nets, insecticides or environmental management 16.
The effect of malaria interventions across the varied epidemiological settings of Africa remained poorly understood owing to the absence of reliable research on the disease pattern. The National Malaria Control Program (NMCP) and the Ghana Health Service have focused on identifying the strategies to achieve relatively high coverage of malaria interventions including distribution of Long-Lasting Insecticidal Nets (LLINs), Indoor residual spraying (IRS), and Intermittent Preventive Treatment in pregnancy (IPTp) coverage. Despite these efforts to completely control the disease, malaria has remained the leading cause of mortality and morbidity in Ghana.
According to a study 17, SMC intervention was piloted in Ghana from July to October 2015 with a trial in the Upper West Region, because it had the highest prevalence of malaria in the country, i.e., 37.8 percent. To mitigate this problem, a number of measures have been taken by the non-governmental organizations (NGOs) and the Ministry of Health to eradicate malaria to attain Sustainable Development Goal three (SDG 3) by 2030 in Ghana. Therefore, a systematic study was carried out to assess the knowledge, attitudes, and practices of people in malaria endemic communities in the northern part of Ghana 18. Meanwhile, the insecticide treated nets have proven to be the best option for malaria prevention. In a study 19, it was reported that due to socio-economic reasons, the ITNs are put into other uses such as nursing of seedlings, protecting chickens, fishing, and fencing of animal pens in the northern regions. However, with all these control measures, malaria has remained the leading cause of morbidity and mortality. It was also responsible for the large burden on the country’s health system 20.
Despite the efforts made by the government of Ghana in the semi-arid zones, characterized by its poor rainfall nature, the Upper West Region is still among the poorest and weakest areas in terms of malaria burden 21. Available statistics shows that the region recorded the highest number of malaria cases of about 51 per cent among children aged six to 59 months and the highest case fatality rate of about 0.69% in the 1st quarter of 2016 22, 23, 20 affirms that the poor are the most affected because of the socio-economic constraints they are faced with, which together with culture and traditions affect the way people perceive the disease regarding its cause and possible treatment. The disease has induced huge economic losses due to ebbed productivity of victims to the tune of hundreds of millions of Dollars, intense morbidity due to chronic disfigurements as well as social stigma on patients.
Malaria mapping is centered on the fact that malaria vector is distributed unevenly both within and between places and therefore exhibits spatial variation 24. The degree of malaria infestation in the upper west region varies from district to district and even from places to places. In Ghana, the non-existence of extensive spatial malaria maps makes it difficult to optimize the scarce resources in achieving targets during the control programs 25. This spatial attribute of malaria infestation across the districts necessitates the need for assessment regarding the changes of malaria transmission, identification of malaria epidemics' areas, and periods with a higher risk using different scales 26. The spatial mapping will assist in the public health planning and provides timely answers to a diverse range of questions related to the key goals of efficiency, effectiveness, and equity in terms of the provision of services 27. Considering the various factors that influence transmission of vector-borne diseases such as malaria, which include environmental and geographical indices and the need to generate useful data on the disease distribution, we targeted at mapping and describing the transmission pattern of malaria in order to identify the high-risk zones of the infection in Upper west region of Ghana, which lies in the semi-arid zone.
Materials and Methods
Profile of the study area
The study was conducted in the Upper west region located in the northwestern corner of Ghana with Wa as its regional capital. Wa is the smallest region in Ghana and covers a geographical area of 18,476 sq.km representing 12.7 percent of the total land area of Ghana. The region is located between latitude 9.8°-11.0°N and longitude 1.6°-3.0° W. Majority of the economically active group work in peasant farming agriculture. The region is located on the guinea savannah vegetation belt. The vegetation consists of grass with scattered drought resistant trees such as the Shea, the Baobab, Dawadawa, and Neem trees. The heterogeneous collection of trees provides all domestic requirements for fuel wood and charcoal, construction of houses, cattle kraals, and fencing of gardens. The shorter shrubs and grass provide fodder for livestock.
The region experiences two climatic seasons: the dry and the wet seasons. The wet season commences from early April and ends in October. The dry season, characterized by the cold and hazy harmattan weather, starts from early November and ends in the latter part of March when the hot weather begins with intensity; this is actually the time of the onset of the early rainfall in April. The minimum temperature of the region is 15℃ at night during the harmattan season, while the maximum temperature is 40℃ in the day during the hot season.
Upper west region has eleven administrative districts with a total population of 576,583, which contains 47.9 percent of male and 52.1 percent of female individuals. The region has ten hospitals, 60 health centers, one health post and three maternity homes. Wa municipality has the highest proportion of the health facilities with about 32.4 percent, while the other health centers are fairly distributed among the other districts. The major malaria transmission pattern in the Upper west is between 6 to 7 months, with the highest number (50–60 %) of cases occurring in July to November 16.
Data collection and analysis
The monthly malaria cases in each district of the upper west region for the seven years period (2010-2016) were obtained from the Upper West Regional Health Directorate. The yearly malaria cases for each of the administrative district were calculated. Projected population for the years 2010-2016 obtained from Ghana Statistical Service was also used for the computation of the malaria incidence. To obtain the incidence rate over the years of study, the average population was computed for each administrative district.
The Shape Thematic Map of the 11 local administrative districts of Upper West Region were created using
Ethical issues
A special malaria data requisition letter was written to the Regional Health Directorate in the Upper West region of Ghana. Cognizance of the privacy, confidentiality, and anonymity right of the research participants was greatly considered by the researchers during the extraction of the data from the database. So, participants' names were not included in the extraction data.
Results
Malaria profile in Upper West
Within the seven-year period of study, a total of about 6,179,171 cases of malaria were reported in the upper west region; with incidence rate of 14.64 cases per 10000 population. The results showed that Wa municipality had the highest number of malaria reported cases (n = 1342286 (21.72%)); whereas, Daffiama-Bussie district had the lowest rate (n = 261847 (4.24%)).
The thematic map in figures 1, 2 shows the malaria incidence rate per 10000 populations for each of the districts of the Upper West region of Ghana. Out of the 11 districts only three (i.e. Wa, Nandowli-Kaleo, and Nandom) had an average incidence rate in the range of 1.48-1.98 per 10000 population. Only Wa east district had an average incidence rate of 0.637-0.895 per 10000 population. The highest annual rate of malaria incidence over the study period was recorded as 1086175 cases (17.58%) in 2013 within a total population of 744821. The lowest reported annual incidence rate of malaria was in 2010 with 587024 (9.50%) out of a population of 702114. The related information is shown in Table 1.
Seasonal incidence rate of malaria
The highest proportion of the malarial cases was reported in the wet season: between April and October (n = 3804583, 61.57%). The number of malaria cases in the dry season, that is between November and March was 38.43 percent. We found that over the period of study, the highest rate for the disease cases was reported in October, i.e., 11.19 percent, whiles the lowest number was recorder in April (6.45%).
Table 1: Malaria incidence in the Upper west region in 2010-2016
| Districts | Total malaria (2010-2016) |
Cumulative population (2010-2016) |
Incidence (%) |
Average population |
Incidence rate/10,000 |
| Daffiama Bussie Issa | 261841 | 244506 | 4.237 | 34929.429 | 1.213 |
| Jirapa | 738806 | 655635 | 11.956 | 93662.143 | 1.277 |
| Lambussie-Karni | 475910 | 384788 | 7.702 | 54969.714 | 1.401 |
| Lawra | 530881 | 406029 | 8.591 | 58004.143 | 1.481 |
| Nandowli-Kaleo | 715359 | 457719 | 11.577 | 65388.429 | 1.770 |
| Nandom | 497647 | 343160 | 8.054 | 49022.857 | 1.643 |
| Sissala East | 417931 | 421174 | 6.764 | 60167.714 | 1.124 |
| Sissala West | 419240 | 367401 | 6.785 | 52485.857 | 1.293 |
| Wa municipality | 1342286 | 795992 | 21.727 | 113713.143 | 1.910 |
| Wa East | 302634 | 535762 | 4.878 | 76537.429 | 0.637 |
| Wa West | 476636 | 603559 | 7.714 | 86222.714 | 0.895 |
| TOTAL | 6,179171 | 5,215725 | 100 | 745103.572 | 14.644 |
Source: Author’s computation from Upper West Regional Health Directorate malaria data (2010-2016)
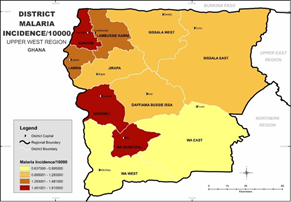
Figure 1: Map of upper west showing the districts profile of malaria incidence per 10000 from 2010– 2016
.png)
Figure 2: District malaria incidence per 10000 overlaid on a vegetation map of Upper West region from 2010– 2016
A-Closed cultivated Savanna woodland (> 20 trees/ha)
B-Closed Savanna woodland (> 25 trees/ha)
C-Grassland with/without scattered trees (0-5 trees/ha)
D-Grassland with/without scatter trees /shrubs
E-Open cultivated Savanna woodland (22-25 trees/ha)
F-Open Savanna woodland (< 25 trees/ha)
G-Riverine Savanna vegetation
H- Settlements
I- Unclassified/bushfires
J- Widely opened cultivated Savanna woodland (6-10 trees/ha)
Figure 1: Map of upper west showing the districts profile of malaria incidence per 10000 from 2010– 2016
Figure 2: District malaria incidence per 10000 overlaid on a vegetation map of Upper West region from 2010– 2016
A-Closed cultivated Savanna woodland (> 20 trees/ha)
B-Closed Savanna woodland (> 25 trees/ha)
C-Grassland with/without scattered trees (0-5 trees/ha)
D-Grassland with/without scatter trees /shrubs
E-Open cultivated Savanna woodland (22-25 trees/ha)
F-Open Savanna woodland (< 25 trees/ha)
G-Riverine Savanna vegetation
H- Settlements
I- Unclassified/bushfires
J- Widely opened cultivated Savanna woodland (6-10 trees/ha)
Discussion
Malaria infestation was categorized into four levels. The levels were: Very high malaria infestation (1.48-1.91), High malaria infestation (1.29-1.48), low malaria infestation (0.89-1.29), and very low malaria infestation (0.63-0.89) per 10000 populations. A visual inspection of the themes in Figure 1 showed a very high malaria infestation in the three administrative districts of Wa, Nandowli-Kaleo, and Nandom. These patterns suggest the occurrences of similar disease risk factors during the time of study. Wa east and Wa west had very low malaria infestation during the period of study. The map can help the health officials and policy makers to detect the vulnerable geographical areas and to conduct educational interventions in them. The highest and lowest malaria cases recorded over the study period were in 2013 and 2010, respectively. The highest proportion of malaria infestation was in the wet season, from April to October. The study showed that the highest incidence rate of the disease occurred in October (11.19%) during the study period. The highest incidence rate was during the October, which could be due to the climax of rainfall regime, crops growth, and thick vegetation cover during this period, which provided a suitable environment for breeding mosquitoes. The seasonal pattern indicates the gradual rise in the incidence rate from May to October, which declines rapidly to a rate of 6.45 percent per annum in April.
The overlay of vegetation on the incidence map did not represent a visually remarkable pattern. So, it did not really influence the transmission greatly. However, the highest incidence over the period was recorded within the grassland with scattered trees (0-5 trees/ha) and areas of widely opened cultivated Savanna woodlands (6-10 trees/ha) as shown in Figure 2.
Conclusion
The study used thematic maps to provide a visual display of malaria incidence in the Upper west region. This procedure provides the authorities the required information to conduct accurate, timely, and cost-effective intervention programs during the disease monitoring. We found that Wa municipality had the highest number of malaria reported cases; 1342286 (21.72%) and Daffiama-Bussie District had the lowest number; 261847 (4.24%) during the period of study. The study also revealed very high rate of malaria incidence (1.48-1.91) per 10000 in Wa, Nandowli-Kaleo, and the Nandom. This pattern suggests the occurrence of similar risk factors in the district at the time of study. The highest proportion of the malaria infestation occurs in the wet season from April to October. It is also worth noting that the highest incidence rate of the disease was recorded within the grassland with scattered trees (0-5 trees/ha) and areas of widely opened cultivated Savanna woodlands (6-10 trees/ha).
Health education to improve the individuals' knowledge of malaria, attitude, and environmental hygiene information must be promoted in the area. The study also recommends disease surveillance interventions to procure a reliable data for malaria management. Efforts should be made to further extend the distribution of mosquitoes treated nets to the areas with very high incidence in the Upper west region of Ghana.
Acknowledgments
We wish to acknowledge the Upper West Regional Directorate for their efficiency, patience, and dedication in granting us the access to the malaria data. We are also indebted to all friends who helped us to edit the manuscript.
Funding
The entire manuscript was unfunded.
Conflict of interest
We have no competing interest regarding this article.
This is an Open Access article distributed in accordance with the terms of the Creative Commons Attribution (CC BY 4.0) license, which permits others to distribute, remix, adapt and build upon this work for commercial use.
References
- Dambach P, Machault V, Lacaux JP, et al. Utilization of combined remote sensing techniques to detect environmental variables influencing malaria vector densities in rural West Africa. Int J Health Geogr. 2012; 11(1): 8.
- Gwitira I, Murwira A, Zengeya FM, et al. Modelled habitat suitability of a malaria causing vector (Anopheles arabiensis) relates well with human malaria incidences in Zimbabwe. Appl Geogr. 2015; 60: 130-8.
- Yahiya A, Aminu F, Tukur AI. Seasonal variation of malaria Infection among Out-Patients Attending Wudil General Hospital, Kano State. Nigeria International Journal of Applied Research and Technology. 2012; 7(1): 79-84
- Cox FE. History of human parasitology. Clin Microbiol Rev. 2002; 15(4): 595-612.
- Igwe NM, Joannes UO, Chukwuma OB, et al. Prevalence and parasite density of asymptomatic malaria parasitemia among unbooked paturients at Abakaliki, Nigeria. J Reprod Health Med. 2014; 3(1): 44-8.
- Prado GR, García CH, Cea LM, et al. Malaria in developing countries. J Infect Dev Ctries. 2014; 8(01): 100-4.
- WHO. World malaria report 2015: summary. Geneva: World Health Organization. 2016
- Abdul-Aziz AR, Harris E, Munyakazi L. Risk factors in malaria mortality among children in Northern Ghana: a case study at the tamale teaching hospital. International Journal of Business and Social Research. 2012; 2(5): 35-45.
- World Health Organization. Malaria rapid diagnostic test performance: results of WHO product testing of malaira RDTs: round 7 (2016-2017).
- World Health Organization. World malaria report 2015. World Health Organization; 2016 Jan 30.
- Strategic Plan for Malaria Control in Ghana: 2008 – 2015. Ghana Ministry of Health, 2008.
- Opoku AA, Ansa-Asare OD. The occurrences and habitat characteristics of mosquitoes in Accra, Ghana. West African Journal of Applied Ecology. 2007; 11(1): 1-7.
- Opare JK, Antobre-Boateng A, Afari E, et al. Community Knowledge and Perceptions on Malaria and Ist Prevention and Control in the Akwapim North Municipality-Ghana. Int J Trop Dis Health. 2014; 4: 82-93.
- Vora N. Impact of anthropogenic environmental alterations on vector-borne diseases. Medscape J Med. 2008; 10(10): 238.
- Kimbi HK, Nana Y, Sumbele IN, et al. Environmental factors and preventive methods against malaria parasite prevalence in rural Bomaka and urban Molyko, Southwest Cameroon. J Bacteriol Parasitol. 2013; 4(162): 4172.
- Nkuo-Akenji T, Ntonifor NN, Ndukum MB, et al. Environmental factors affecting malaria parasite prevalence in rural Bolifamba, South-West Cameroon. Afr J Health Sci. 2006; 13(1): 40-6.
- Nonvignon J, Aryeetey GC, Issah S, et al. Cost-effectiveness of seasonal malaria chemoprevention in upper west region of Ghana. Malar J. 2016; 15(1): 367.
- Saaka M, Glover K. Assessing the prevalence of malaria and the use of insecticide treated bed nets in Ghana. UDS International Journal of Development. 2017; 4(1): 10-9.
- Diema KK, Dodam KK, Aarah-Bapuah M, et al. Barriers to sustained use of the insecticide treated bed net in the upper east region of Ghana. Int J Community Med Public Health. 2017; 4(2): 500-5.
- Stevens G, Mascarenhas M, Mathers C. WHO brochure». Bulletin of the World Health Organization. 2009.
- Nkegbe PK, Kuunibe N, Sekyi S. Poverty and malaria morbidity in the Jirapa District of Ghana: A count regression approach. Cogent Economics & Finance. 2017; 5(1):1-13.
- Ghana Health Service. National Malaria Control Programme, First quarter malaria bulletin, Ghana. 2016.
- GNA. Upper West Region has highest malaria cases. Ghana Business News. Retrieved from: https://www.ghanabusinessnews.com [Cited July 10, 2015].
- Andrew O. An assessment of the spatial pattern of malaria infection in Nigeria. International Journal of Medicine and Medical Sciences. 2014; 6(2): 80-6.
- Osei FB and Yibile MM. Geographic patterns of malaria in the brong ahafo region of Ghana. Austin J Public Health Epidemiol. 2015; 2(2): 10-20.
- Gaudart J, Poudiougou B, Dicko A, et
al. Space-time clustering of childhood malaria
at the household level: a dynamic cohort in a Mali village. BMC Public Health. 2006; 6(1): 286. - Onagh M, Kumra VK, Rai PK. Application of multiple linear regression model in landslide susceptibility zonation mapping the case study Narmab basin Iran. 2002.
Type of Study: Original articles |
Subject:
Special
Received: 2018/11/25 | Accepted: 2019/01/20 | Published: 2019/03/10
Received: 2018/11/25 | Accepted: 2019/01/20 | Published: 2019/03/10
Send email to the article author
| Rights and permissions | |
 |
This work is licensed under a Creative Commons Attribution-NonCommercial 4.0 International License. |
