

Volume 3, Issue 2 (June 2018)
J Environ Health Sustain Dev 2018, 3(2): 496-503 |
Back to browse issues page


Download citation:
BibTeX | RIS | EndNote | Medlars | ProCite | Reference Manager | RefWorks
Send citation to:


BibTeX | RIS | EndNote | Medlars | ProCite | Reference Manager | RefWorks
Send citation to:
Fallahzadeh R A, Ghadirian D. Spatial Distribution, Health Risk Assessment and Survey of Fluoride Pollution Source with GIS in Drinking Water: A Case Study, in Abarkouh, Iran
. J Environ Health Sustain Dev 2018; 3 (2) :496-503
URL: http://jehsd.ssu.ac.ir/article-1-116-en.html
URL: http://jehsd.ssu.ac.ir/article-1-116-en.html


Environmental Science and Technology Research Center, Department of Environmental Health Engineering, Shahid Sadoughi University of Medical Sciences, Yazd, Iran.
Full-Text [PDF 584 kb]
(949 Downloads)
| Abstract (HTML) (2176 Views)
.png)
Figure 1: Geographic location of the studied area
.png)
.png)
Figure 3: Zoning the fluoride concentration in the studied area
.png)
Figure 4: The range of the HQ for the young children population
.png)
Figure 5: The range of the HQ for the Teens population
.png)
Figure 6: The HQ range for the Adults population
Figure 6: The results of the sensitivity analysis of the variables involved in calculating the HQ by the studied groups
.png)
Figure 7: Moran's Index Analysis Results
Full-Text: (897 Views)
Spatial Distribution, Health Risk Assessment and Survey of Fluoride Pollution Source with GIS in Drinking Water: A Case Study, in Abarkouh, Iran
Reza Ali Fallahzadeh 1, Davood Ghadirian 1*
1 Environmental Science and Technology Research Center, Department of Environmental Health Engineering, Shahid Sadoughi University of Medical Sciences, Yazd, Iran.
Reza Ali Fallahzadeh 1, Davood Ghadirian 1*
1 Environmental Science and Technology Research Center, Department of Environmental Health Engineering, Shahid Sadoughi University of Medical Sciences, Yazd, Iran.
| A R T I C L E I N F O | ABSTRACT | |
| ORIGINAL ARTICLE | Introduction: Exposure to high concentrations of fluoride in drinking water can negatively affect lung, liver and kidney tissues, and cause skeleton pain; however, lack of fluoride can cause tooth decay and bone problems. Materials and Methods: In this study, the concentration of fluoride was investigated and its spatial distribution was carried out with Arc GIS software in underground water of Abarkouh aquifer. The health risk assessment, type of pollution distribution and its source was investigated using Moran's index. Results: The average concentration of fluoride in 21 wells was 0.623 ± 0.296 mg/L which in 47.61% were less than the minimum concentration standard range set by the WHO guidelines. The Moran's index for fluoride concentration in the study area was 0.653 and given the z-score of 4.117. There is less than 1% likelihood that this clustered pattern could be the result of a random chance. Conclusion: According to the results, Non-carcinogenic risk indicates a high risk for children (HQ = 1.03E0). The source of pollution is close to well No. 15. Investigating the study area and eliminating the pollution source is effective in decreasing the fluoride concentration of water and can reduce the health risk for children. |
|
| Article History: Received: 29January 2018 Accepted: 20 April 2018 |
||
| *Corresponding Author: Davood Ghadirian Email: Davood_ghadirian@yahoo.com Tel: +989134516993 |
||
| Keywords: Fluorides, Geographic Information System, Risk Assessment, Drinking Water. |
Citation: Fallahzadeh RA, Ghadirian D. Spatial Distribution, Health Risk Assessment and Survey of Fluoride Pollution Source with GIS in Drinking Water; A Case Study, in Abarkouh, Iran . J Environ Health Sustain Dev. 2018; 3(2): 496-503.
Introduction
Fluoride is a vital element in the human body and most of which is supplied through water. At low concentrations, it is essential and is harmful at high concentrations 1. The lack of fluoride can cause tooth decay and bone problems. Tooth decay has been significantly increased in societies with a fluoride content in water less than 0.5 mg/L 2. Long-term consumption of its anion can have adverse effects, including bone and dental fluorosis, infertility, neurological problems, Alzheimer and thyroid problems 3- 5. Factors affecting the formation of fluoride contamination in water include weathering
and leaching of rocks and fluoride-containing minerals, long reaction times of water and stone, the existence of active ions of sodium and bicarbonate, and pH 6, 7. The pH is proportional to the calcium and magnesium deficiency and the fluoride concentration, so that alkaline water provides suitable conditions for the dissolution of the fluoride 3, 8. So far, little research has been done on the contamination of fluoride in groundwater in Iran. In the study of the cause of the increase of fluoride in the water of Maku region of Iran in western Azerbaijan province 9, the results indicate high concentration of fluoride in samples taken from basaltic areas. The accumulation of fluoride in groundwater is related to the presence of Na+ and HCO3- ions, so that these ions help to increase the solubility of fluoride-rich minerals. In the study of fluoride-rich waters in Mysonami area of Japan 10 it was concluded that the process of dissolving fluoride-containing minerals liberated fluoride. Investigating the reasons for the high fluoride in Pakistan waters 11 showed that the most important geochemical characteristics that cause high fluoride levels, are including TDS, alkaline pH, high Na+ concentration and high sodium absorption rate. Investigation of the chemical processes controlling the fluoride accumulation in the underground water of Taiwan basin showed that high fluoride waters are seen in depth of less than 4 meters. This increase in fluoride in this water is due to diet; furthermore, the chemical composition of water affects the amount of solvent. The water having bicarbonate ions and sodium ions with alkaline pH increase the solubility of fluoride-rich minerals. A study in the water containing fluoride in Malawi 12 showed that the fluoride source is weathered biotite, hornblende and fluorite. Many of these waters have a superficial origin that penetrates into the weathering rock and dissolves fluoride. High levels of fluoride can also have volcanic origin. Surface and underground water studies using multiple analysis method in western of Niger Delta 13 revealed that fluoride pollution occurs in shallow water and is the main cause for the presence of fluoride-containing minerals, namely, hydroapatite, fluorapatite, cryolite and fluorespar. Furthermore, the water is rich in sodium and rich in magnesium and calcium ions. High levels of fluoride have been reported in some parts of the country, including the plains of Poldasht and Bazargan in Western Azarbaijan province 9. Geographic information system (GIS) is a geostatistical technique that uses the ArcGIS software as a suitable tool to represent spatial distributions of various parameters in different environments like groundwater 14. The GIS is a suitable tool to determine the quality of contaminants in groundwater between distant points 15- 18.
This study aimed to evaluate the concentration of fluoride in groundwater of Abarkouh, the spatial distributions and investigation of the source of contamination with the GIS software. Ultimately the health risk assessment of contact with fluoride in the studied population was evaluated.
Materials and Methods
Studied area
For this study, 21 drinking water supply wells in Abarkouh were sampled in 4 periods in 2016 (one sample a season). Fluoride concentration data were obtained from the health center laboratory of Abarkouh. The samples were collected from all wells that used as supply of drinking water in study area. For water sampling, used of a 1 L polyethylene. Then samples were labeled and transferred to the lab in 4 °C. Samples were analyzed using a flame atomic absorption spectrometer (FAAS, Spectra model AA-20, Varian, Australia). The demographic and geographic data of the studied area are presented in Table 1. The location of the wells in the county was shown in Figure 1.
Table 1: The demographic and geographic data of the studied area
| City | Population | City location | Study area (wells) location |
Number of wells | Average flow (lit/sec) |
| Abarkouh | 51552 | 31° 7'N-53°17'E | 30˚52'N-31˚12'N 52˚50'E-53˚10'E |
21 | 22.22 ± 2.63 |
Figure 1: Geographic location of the studied area
Spatial distributions
In this study ArcGIS 10.4.1 (Esri, Berkeley, CA, USA) was used for spatial and fluoride distribution in the studied areas. The inverse distance weighting (IDW) method was used to prepare a fluoride zonation map. The IDW is an algorithm that uses data interpolation in a spatial form to predict the variable value by using the average weight of each variable and the distance between points 15. The Moran's Index function in GIS software was used to study the source of contamination in this study.
Health risk assessment
In this study, three age groups of people were determined as 3 to 10 years, 11 to 20 years old and 21 to 72 years old to assess the health risk of Abarkouh population and evaluate their health potential 2, 6, 19. Moreover, the amount of daily exposure to fluoride by drinking water was measured using the formula 1, which was introduced by the USEPA (1989) 20.
Formula 1:
EDI formula estimates the amount of daily received fluoride by drinking water based on mg/kg/day. In this formula, Cw is the fluoride concentration in drinking water based on mg/L, IRw is daily drinking water consumption based on person/day, EF is exposure frequency based on day/year, ED is exposure duration in terms of years, BW is Body weight in terms of Kg and AT is the average time in terms of day.
The Hazard quotient (HQ), the non-contact risk estimation for fluoride by drinking water, was calculated using Formula 2.
Formula 2:
RfD, expressing the reference fluoride dose via a special contact point in mg/kg/day, equals to 0.6 mg/kg/day 21.
Results
Fluoride concentrations were different in the studied area, from 0.14 mg/L to 1.17 mg/L with an average of 0.662 ± 0.33 mg/L, which was lower than the maximum standard value determined by the WHO (1.5 mg/L). However, it was less than the minimum standard in 47.61% of the cases. The histogram of fluoride concentration in drinking water in the Abarkouh area is shown in Figure 2. Overall, 52.38% of the samples were in the WHO standard range (0.5-1.5 mg/L), compared with WHO, EU 22 and Canada 23 guidelines. Moreover, 47.61% of cases were less than 0.5 mg/L.
Figure 2: Histogram of the fluoride concentration in the studied area and the number of repetitions
Discussion
Spatial Distributions
The spatial distribution of fluoride by the
IDW method with RMSE 0.091 in Abarkouh groundwater is shown in Figure 3. Drinking water well No. 15 has the highest concentration of fluoride in terms of spatial range. Groundwater in the eastern part of the catchment area has a fluoride concentration of less than 0.5 mg/L, less than the WHO guidelines 24. According to studies, decreasing the amount of fluoride from 0.5 mg/L leads to increased dental caries 25- 27.
Figure 3: Zoning the fluoride concentration in the studied area
Health Risk Assessment
In this study in order to evaluate the health risk of fluoride in groundwater consumed for drinking, the non-carcinogenic risk (HQ) was used. The EDI is presented in Table 2 for populations in three age groups of young children, teenagers and adults exposed to fluoride by drinking water. For all the age groups except children, the average non-carcinogenic risk value was estimated less than 1 and negligible (Figures 4- 6). The reason for the high non-carcinogenic risk for young children was the low BW for this group compared to other age groups 28. Initial signs of acute fluoride intoxication occur at a dose of 0.3 mg F kg-1 BW 29. In this study, none of the age groups studied received this dose. For all the studied areas, the non-carcinogenicity of fluoride was classified as Adults > Teenagers > Children for three groups of exposed population. According to the results of health risk assessment, which is consistent with the study by Zhang et al. 30 and Guissouma et al. 31, the age group of young children is at potential risk.
In this study in order to evaluate the health risk of fluoride in groundwater consumed for drinking, the non-carcinogenic risk (HQ) was used. The EDI is presented in Table 2 for populations in three age groups of young children, teenagers and adults exposed to fluoride by drinking water. For all the age groups except children, the average non-carcinogenic risk value was estimated less than 1 and negligible (Figures 4- 6). The reason for the high non-carcinogenic risk for young children was the low BW for this group compared to other age groups 28. Initial signs of acute fluoride intoxication occur at a dose of 0.3 mg F kg-1 BW 29. In this study, none of the age groups studied received this dose. For all the studied areas, the non-carcinogenicity of fluoride was classified as Adults > Teenagers > Children for three groups of exposed population. According to the results of health risk assessment, which is consistent with the study by Zhang et al. 30 and Guissouma et al. 31, the age group of young children is at potential risk.
Table 2: The amount of EDI and HQ calculated by the studied groups
| Parameter | Adults | Teenagers | Children | |||
| Mean | 95th percentile | Mean | 95th percentile | Mean | 95th percentile | |
| EDI | 2.22E-3 | 6.91E-2 | 9.41E-3 | 2.80E-2 | 1.89E-2 | 6.23E-2 |
| HQ | 3.78E-2 | 1.17E-1 | 1.54E-1 | 4.84E-1 | 3.06E-1 | 1.03E0 |
Figure 4: The range of the HQ for the young children population
Figure 5: The range of the HQ for the Teens population
Figure 6: The HQ range for the Adults population
Sensitivity Analysis
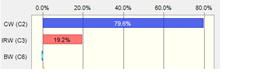
Sensitivity analysis was performed to determine the most effective variable on the calculated health risk value. Figure 6 shows the results of the sensitivity analysis for the assessment of non-carcinogenic risk for the three age groups of young children, teenagers and adults exposed to fluoride.
In all the age groups, the concentration of fluoride (CW) in drinking water was the most important variable affecting the health risk values. The factors affecting the amount of drinking water consumed in a day are the weather conditions of the that area, so that, with increasing temperature, drinking water consumption (IRW) increases and the person is exposed to higher levels of fluoride 32, 33. Fluoride can also enter the human body through other ways of contact, such as absorption through skin contact 21 and eating various foods 34.
| Children | Teenagers | Adults |
 |
 |
 |
Figure 6: The results of the sensitivity analysis of the variables involved in calculating the HQ by the studied groups
Analysis of Moran's Index
The Moran's index for fluoride concentration in the studied area was 0.653 with a z-score of 4.117, representing the cluster pattern of the distribution of fluoride concentration. The cluster pattern indicates the point of contamination (Figure 7). According to the results of zoning, the source of contamination is near well No. 15.
The Moran's index for fluoride concentration in the studied area was 0.653 with a z-score of 4.117, representing the cluster pattern of the distribution of fluoride concentration. The cluster pattern indicates the point of contamination (Figure 7). According to the results of zoning, the source of contamination is near well No. 15.
Figure 7: Moran's Index Analysis Results
Conclusion
In this study, the concentration of fluoride was evaluated in 21 drinking water supply wells in Abarkouh. The results showed that the concentration of fluoride in water in these wells is less than the maximum amount of guidelines set by the Iranian Standards Institute and, on the other hand, is lower than the minimum standard in 47% of the cases. Then the zoning of fluoride was done in the studied area. The results showed that the highest concentration of fluoride was in well No. 15. According to the Moran's index, the contamination spread pattern is cluster that indicates the point of contamination. The HQ non-carcinogenic risk assessment was performed for the three groups of age in the studied area and it was observed that the HQ values in the young children group were greater than 1 and therefore were at risk. The sensitivity analysis test showed that the most important factor in increasing the health risk is the fluoride concentration in drinking water; therefore, reducing the concentration of fluoride can reduce the risk.
Acknowledgements
The authors would like to thank the Environmental Science and Technology Research Center of Shahid Sadoughi University of Medical Sciences for technical support.
Funding
This study was funded by the authors.
Conflict of interest
No conflict of interest has been stated by the authors.
This is an Open Access article distributed in accordance with the terms of the Creative Commons Attribution (CC BY 4.0) license, which permits others to distribute, remix, adapt and build upon this work for commercial use.
References
1. Zhu L, Zhang H, Xia B, et al. Total fluoride
in Guangdong soil profiles, China: spatial distribution and vertical variation. Environ Int 2007; 33(3): 302-8.
2. Fallahzadeh RA, Miri M, Taghavi M, et al. Spatial variation and probabilistic risk assessment of exposure to fluoride in drinking water. Food Chem Toxicol. 2018; 113: 314-321.
3. Farooqi A, Masuda H, Firdous N. Toxic fluoride and arsenic contaminated groundwater in the Lahore and Kasur districts, Punjab, Pakistan and possible contaminant sources. Environ Pollut. 2007; 145(3): 839-49.
4. Chinoy N. Effects of fluoride on physiology of animals and human beings. Indian J Environ Toxicol. 1991; 1(1): 17-32.
5. Harrison PT. Fluoride in water: a UK perspective. J Fluor Chem. 2005; 126 (11-12): 1448-56.
6. Fallahzadeh RA, Khosravi R, Dehdashti B, et al. Spatial distribution variation and probabilistic risk assessment of exposure to chromium in ground water supplies; a case study in the east of Iran. Food Chem Toxicol. 2018; 115: 260-266.
7. Miri M, Bhatnagar A, Mahdavi Y, et al. Probabilistic risk assessment of exposure to fluoride in most consumed brands of tea in the Middle East. Food Chem Toxicol. 2018; 115: 267-72.
8. Guo Q, Wang Y, Ma T, et al. Geochemical processes controlling the elevated fluoride concentrations in groundwaters of the Taiyuan Basin, Northern China. J Geochem Explor. 2007; 93(1):1-12.
9. Asghari Moghaddam A, Fijani E. Hydrogeological and Hydrochemical Studies of Basaltic and Karstic Aquifers in Maku Area in Relation to Geological Formations. Geosciences. 2008; 18(67): 2-13.
10. Abdelgawad AM, Watanabe K, Takeuchi
S, et al. The origin of fluoride-rich groundwater in Mizunami area, Japan Mineralogy and geochemistry implications. Eng Geol. 2009; 108(1-2): 76-85.
11. Rafique T, Naseem S, Usmani TH, et al. Geochemical factors controlling the occurrence of high fluoride groundwater in the Nagar Parkar area, Sindh, Pakistan. J Hazard Mater. 2009; 171(1-3): 424-30.
12. Msonda K, Masamba W, Fabiano E. A study of fluoride groundwater occurrence in Nathenje, Lilongwe, Malawi. Physics and Chemistry of the Earth, Parts A/B/C. 2007; 32(15-18): 1178-84.
13. Omo-Irabor O, Olobaniyi SB, Oduyemi K, et al. Surface and groundwater water quality assessment using multivariate analytical methods: a case study of the Western Niger Delta, Nigeria. Physics and Chemistry of the Earth, Parts A/B/C. 2008; 33(8-13): 666-73.
14. Ehsani E, Mirhosseini Dehabadi A, Ehrampoush MH. Geo-statistical Distribution of Heavy Metals in Karoon River’s Soil by Geographic Information System. Journal of Environmental Health and Sustainable Development. 2017; 2(1): 221-8.
15. Khosravi R, Eslami H, Almodaresi SA, et al. Use of geographic information system and water quality index to assess groundwater quality for drinking purpose in Birjand City, Iran. Desalination Water Treat. 2017; 67(2017): 74-83.
16. Fallahzadeh RA, Almodaresi SA, Dashti MM, et al. Zoning of nitrite and nitrate concentration in groundwater using Geografic information system (GIS), case study: drinking water wells in Yazd City. Journal of Geoscience and Environment Protection. 2016; 4(03): 91.
17. Azimzadeh HR, Fallahzadeh RA, Ghaneian MT, et al. Investigation of chemical characteristics and spatiotemporal quantitative changes of dust fall using GIS and RS technologies; a case study, Yazd city, central plateau of Iran. Environmental Health Engineering and Management Journal. 2017; 4(1): 45-53.
18. Ehrampoush MH, Jamshidi S, Zare Sakhvidi MJ, et al. A Comparison on Function
of Kriging and Inverse Distance Weighting Models in PM10 Zoning in Urban Area. Journal of Environmental Health and Sustainable Development. 2017; 2(4): 379-87.
19. Fallahzadeh RA, Ghaneian MT , Miri M, et al. Spatial analysis and health risk assessment of heavy metals concentration in drinking water resources. Environ Sci Pollut Res Int. 2017; 24(32): 24790-802.
20. EPA A. Risk Assessment Guidance for Superfund. Volume I: Human Health Evaluation Manual (Part A): EPA/540/1-89/0021989.
21. Huang D, Yang J, Wei X, et al. Probabilistic risk assessment of Chinese residents' exposure to fluoride in improved drinking water in endemic fluorosis areas. Environ Pollut. 2017; 222: 118-25.
22. DECLG, (Department of the Environment CaLG. European ::union:: (Drinking Water) Regulations. 2014; S.I. No. 122.
23. Toft P, Malaiyandi M, Hickman J. Guidelines for Canadian drinking water quality. Ottawa: ACS Publications; 1987.
24. WHO G. Guidelines for drinking-water quality. World Health Organization. 2011; 216: 303-4.
25. Jones S, Burt BA, Petersen PE, et al. The effective use of fluorides in public health. Bulletin of the World Health Organization. 2005; 83(9): 670-6.
26. Dissanayake C. The fluoride problem in the ground water of Sri Lanka environmental management and health. Int J Environ Stud. 1991; 38(2-3): 137-55.
27. Ozsvath DL. Fluoride and environmental health: a review. Reviews in Environmental Science and Bio/Technology. 2009; 8(1): 59-79.
28. Kohn WG, Maas WR, Malvitz DM, et al. Recommendations for using fluoride to prevent and control dental caries in the United States. 2001.
29. Akiniwa K. Re-examination of acute toxicity of fluoride. Fluoride. 1997; 30(2): 89-104.
30. Sun L, Gao Y, Liu H, et al. An assessment of the relationship between excess fluoride intake from drinking water and essential hypertension in adults residing in fluoride endemic areas. Sci Total Environ. 2013; 443: 864-9.
31. Guissouma W, Hakami O, Al-Rajab AJ, et al. Risk assessment of fluoride exposure in drinking water of Tunisia. Chemosphere. 2017; 177: 102-8.
32. Craig L, Lutz A, Berry KA, et al. Recommendations for fluoride limits in drinking water based on estimated daily fluoride intake in the Upper East Region, Ghana. Sci Total Environ. 2015; 532: 127-37.
33. Sohn W, Heller KE, Burt BA. Fluid consumption related to climate among children in the United States. J Public Health Dent. 2001; 61(2): 99-106.
34. Erdal S, Buchanan SN. A quantitative look at fluorosis, fluoride exposure, and intake in children using a health risk assessment approach. Environ Health Perspect. 2005; 113(1): 111.
Type of Study: Original articles |
Subject:
Special
Received: 2018/01/29 | Accepted: 2018/04/20 | Published: 2018/06/13
Received: 2018/01/29 | Accepted: 2018/04/20 | Published: 2018/06/13
| Rights and permissions | |
 |
This work is licensed under a Creative Commons Attribution-NonCommercial 4.0 International License. |
