

Volume 11, Issue 3 (September 2026)
J Environ Health Sustain Dev 2026, 11(3): 3140-3151 |
Back to browse issues page


Ethics code: 1260


Download citation:
BibTeX | RIS | EndNote | Medlars | ProCite | Reference Manager | RefWorks
Send citation to:


BibTeX | RIS | EndNote | Medlars | ProCite | Reference Manager | RefWorks
Send citation to:
Mohammadi E, Babaei M, Naeimi B, Gholizadegan E, Hasanzadeh S, Deghani S et al . Exploring Regional Factors Associated with Mortality in Showt City, Northwest of Iran: A Study in Environmental, Socioeconomic, And Lifestyle Epidemiology. J Environ Health Sustain Dev 2026; 11 (3) :3140-3151
URL: http://jehsd.ssu.ac.ir/article-1-1104-en.html
URL: http://jehsd.ssu.ac.ir/article-1-1104-en.html
Ebrahim Mohammadi  , Majid Babaei , Bahram Naeimi , Erfan Gholizadegan , Shila Hasanzadeh , Sima Deghani , Amir Mohammadi *
Social Determinants of Health Research Center, Clinical Research Institute, Urmia University of Medical Sciences, Urmia, Iran
Full-Text [PDF 764 kb]
(62 Downloads)
| Abstract (HTML) (159 Views)
Full-Text: (12 Views)
Exploring Regional Factors Associated with Mortality in Showt City, Northwest of Iran: A Study in Environmental, Socioeconomic, And Lifestyle Epidemiology
Ebrahim Mohammadi 1,2 , Majid Babaei 3 , Bahram Naeimi 4 , Erfan Gholizadegan 1 , Shila Hasanzadeh 1 , Sima Deghani 1 , Amir Mohammadi 1*
1 Social Determinants of Health Research Center, Clinical Research Institute, Urmia University of Medical Sciences, Urmia, Iran.
2 Department of Internal Medicine, School of Medicine, Imam Khomeini Hospital, Urmia University of Medical Sciences.
3 Department of Economic Sciences, Faculty of Economics and Management, Urmia University, Urmia, Iran.
4 Department of Environmental Health Engineering, School of Public Health, Tehran University of Medical Sciences, Tehran, Iran.
Ebrahim Mohammadi 1,2
1 Social Determinants of Health Research Center, Clinical Research Institute, Urmia University of Medical Sciences, Urmia, Iran.
2 Department of Internal Medicine, School of Medicine, Imam Khomeini Hospital, Urmia University of Medical Sciences.
3 Department of Economic Sciences, Faculty of Economics and Management, Urmia University, Urmia, Iran.
4 Department of Environmental Health Engineering, School of Public Health, Tehran University of Medical Sciences, Tehran, Iran.
| A R T I C L E I N F O | ABSTRACT | |
| ORIGINAL ARTICLE | Introduction: Mortality is influenced by demographic, socioeconomic, environmental, and lifestyle factors. This study investigated the factors associated with mortality in Showt City, West Azerbaijan, Iran, between 2015 and 2019. Materials and Methods: In this descriptive cross-sectional study, data from 260 deceased individuals were collected using structured questionnaires and interviews with first-degree relatives. Information on demographic characteristics, causes of death (ICD-10), and associated factors was analyzed using SPSS version 16. Results: Among the 260 deceased individuals, 58.5% (n = 152) were male and 41.5% (n = 108) were female, with a mean age at death of 66.49 ± 23.36 years. The highest proportion of deaths occurred in those aged ≥ 74 years (46.5%). Cardiovascular disease was the leading cause of death (38.1%). Major risk factors included smoking (51.9%), complete lack of regular physical activity (100%), illiteracy (64.2%), low monthly income (< 2.5 million Tomans, 51.9%), low consumption of vegetables (48.8% consumed only once per week), and high fast-food intake (36.9%). Environmental conditions were relatively favorable (safe water access: 97.7%; proper sewage system: 100%). Conclusion: This study highlights the significant burden of cardiovascular disease and the critical role of modifiable lifestyle factors, such as smoking, physical inactivity, and poor nutrition, in mortality rates in Showt City. The findings provide important local evidence for health policymakers to develop targeted interventions to reduce preventable deaths in the region. |
|
Article History: Received: 15 May 2026 Revised: 13 July 2026 Accepted: 20 July 2026 |
||
*Corresponding Author: Amir Mohammadi Email: mohammadiurm@gmail.com Mohammadi_a@urmia.ac.ir Tel: +98 44 32752300 |
||
Keywords: Mortality, Non-Communicable Diseases, Socioeconomic Factors, Environmental Influences. |
Citation: Mohammadi E, Babaei M, Naeimi B, et al. Exploring Regional Factors Associated with Mortality in Showt City, Northwest of Iran: A Study in Environmental, Socioeconomic, And Lifestyle Epidemiology. J Environ Health Sustain Dev. 2026; 11(3): 3140-51.
Introduction
In recent decades, with the advancement of science and technology worldwide, significant efforts have been made to reduce the incidence of diseases and premature mortality. The aim is to improve living standards and increase healthcare quality, thereby extending the average human lifespan and enhancing both the quality and quantity of life 1. Mortality is one of the key indicators of population health, which is closely linked to healthcare systems, as well as socioeconomic, environmental, and nutritional factors 2. Although population health has improved globally over the long term, health disparities still exist, both between and within countries. These health inequalities are not only unjust but also carry significant economic and social costs 3, 4. A better understanding of the factors influencing mortality rates in a country is crucial for economic development, as a healthy nation is a prerequisite for a wealthy nation 5, 6. Healthy individuals can directly and indirectly contribute to a country’s economic growth and development by providing labor in various sectors, which in turn improves per capita income and reduces poverty and income inequality. Governments must actively strive to protect their citizens' lives and reduce the incidence of unnecessary deaths and preventable diseases 7, 8. Mortality rates, or the age and characteristics of death, are influenced by various factors, such as environmental conditions (e.g., air quality, water quality, and soil quality), societal happiness, cultural, economic, and social characteristics, lifestyle, nutrition, welfare level, healthcare standards in a community, and the availability of healthcare infrastructure, such as water treatment plants and sewage systems. It should also be noted that genetic factors play a role in these outcomes 9, 10.
Therefore, mortality rates and their characteristics are influenced by various factors. Considering this, mortality rates and age at death can be viewed as indicators reflecting health inequalities within different societies. According to the World Health Organization, global life expectancy increased from 66.8 years in 2000 to 73.4 years in 2019, representing a rise of over 6 years 11, 12, 13.
Similarly, studies have shown that in Iran, the average lifespan increased from 56 years in 1985 to 74 years in 2013. Key factors identified as influencing this increase in Iran include per capita GDP, the number of doctors per 10,000 people, food availability, literacy rate, and total fertility rate. However, studies suggest that paying attention to factors outside the healthcare sector could further improve the average lifespan .
In Iran, the child mortality rate (deaths per 1,000 live births) in 2019 was 16.0 (95% UI: 13.0-19.6). The adult mortality rates for women and men were 6.1 (5.4-6.8) and 11.5 (10.3-12.8) percent, respectively14. Variations in adolescent mortality between countries and based on gender are increasing, largely due to slow progress in reducing mortality among males and adolescents. Improving adolescent mortality rates globally requires action to address the specific vulnerabilities of this age group, which are often overlooked 15. To achieve the goal of survival and flourishing, and to realize the full potential of children and adolescents as human capital, all countries must make strategic investments in education and healthcare systems, including human resources for health, necessary infrastructure, and similar measures to enhance support for children 16, 17.
Although national-level data on mortality trends in Iran are available, there is a significant knowledge gap regarding local patterns in border regions, such as West Azerbaijan province. Showt city, located in this province, faces unique challenges, including a cold and dry climate, environmental pressures, socioeconomic disparities, and specific lifestyle factors that may influence mortality differently from other parts of the country. According to available statistics, cardiovascular disease accounts for a substantial proportion of deaths nationally; however, region-specific data are limited. This study is novel as it provides the first detailed epidemiological profile of factors associated with mortality (environmental, socioeconomic, and lifestyle) in Showt city based on data from 2015 to 2019. By addressing this gap, the present study aims to offer valuable local evidence to support targeted public health interventions in underserved border areas of Iran.
Materials and Methods
Study area
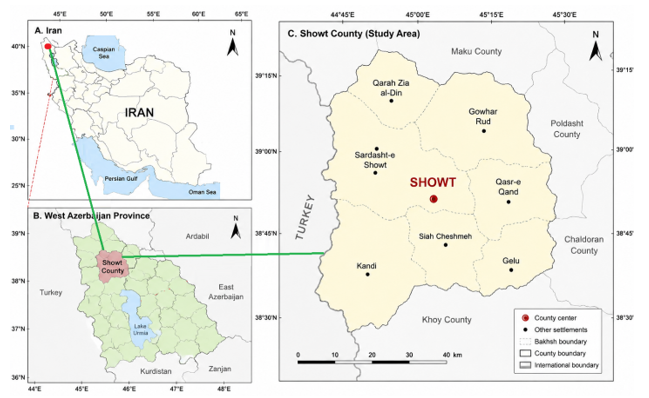
The city of Showt is located in West Azerbaijan Province in northwestern Iran (Figure. 1), covering an area of 8 square kilometers. It has a cold and dry climate, with relatively low rainfall throughout the year. The average annual temperature in Showt is 12.4°C and the average annual rainfall is 264 millimeters18. The lowest rainfall occurs in August, with an average of 7 mm. The highest rainfall occurs in May, with an average of 46 milliliters. The average temperature in July is 26°C, the warmest time of the year, while January is the coldest month, with an average temperature of -2.5°C. The difference in rainfall between the driest and wettest months is 39 mm, and the annual temperature variation is 28.5°C. Figure 1 illustrates the geographical location of the study area, including the position of Showt county within West Azerbaijan province and Iran.
Figure 1: Location of the study area (Showt County) in West Azerbaijan Province, northwestern Iran.
Samples collection
This was a descriptive cross-sectional study. The study population consisted of 260 deceased individuals from Showt County who were included in the study after sampling, covering the years 2015–2019. The sample size was calculated using Cochran’s formula (Equation 1) for a finite population:
n = [Z² × p × (1−p)] / e² (Equation 1)
Where:
Z = 1.96 (corresponding to 95% confidence level),
p = 0.5 (maximum variability assumed),
e = 0.05 (margin-of-error).
The initial sample size was adjusted for the finite population of Showt County using a correction formula. The final calculated sample size was 260. This calculation was performed based on the approach used in the study by Majidi et al.19
Data related to demographic characteristics, place of residence, and causes of death, classified according to ICD10 codes, were collected from the Death Registration Unit of the Health Deputy at the Urmia University of Medical Sciences. Standard checklists, which included demographic characteristics, socioeconomic status, underlying diseases, lifestyle factors, nutritional factors, and environmental factors—previously validated for reliability and validity—were used. After obtaining the ethics code from the Ethics Committee of the Urmia University of Medical Sciences, the researcher, with an introduction letter from the Research Center for Social Determinants of Health and after making the necessary arrangements, visited the target households. The researcher provided sufficient explanations and clarified the questions, requesting careful responses. According to the study's objective, cluster sampling was conducted by visiting different geographical directions of Showt city (north, south, west, and east), and the required information was gathered through questionnaires and face-to-face interviews with first-degree relatives. The purpose of the interview was first explained to the deceased individual's family, and after obtaining their consent, the interview was conducted. If the respondents were not literate enough to complete the questionnaire, it was filled out through a clear and transparent interview process.
The criteria for inclusion in this study were the cooperation of the deceased individual's relatives in completing the questionnaire, ensuring the health of the interviewee, and the interviewee's memory retention. The exclusion criteria were lack of cooperation from relatives, uncertainty about the interviewee's health, and lack of memory retention.
Data analysis
After recording all information in the structured and researcher-designed checklists and conducting a final check for accuracy and precision, the data were collected. These data were entered into a computerized database using SPSS16 software and were re-evaluated for data entry accuracy. Finally, quantitative variables were reported as mean ± standard deviation (SD), and qualitative variables were presented as frequencies and percentages. The distribution of causes of death was analyzed descriptively according to sex, age group, and other variables (socioeconomic status, environmental factors, lifestyle, nutrition, and demographic characteristics). The results were ranked based on frequency and presented in tables and figures. No inferential statistical tests were applied because of the descriptive nature of the study.
Results
Out of 260 deceased individuals in Showt County, 152 (58.5%) were male and 108 (41.5%) were female. The average age of the deceased was 66.49 ± 23.36 years, ranging from 3 to 102 years. The highest mortality rate occurred among individuals aged ≥ 74 years, representing 46.5% (121 cases) of the total deaths, while the lowest mortality rate was observed among individuals under the age of 15, accounting for only 4.2% (11 cases). Marital status data showed that 165 individuals (63.5%) were married, 31 (11.9%) were single, 57 (21.9%) were widowed, and 7 (2.7%) were divorced (Table 1).
Table 1: Frequency Distribution of the Personal Characteristics of Deceased Individuals in Showt county from 2015 to 2019.
| Factors | Numbers | Percentage (%) | |
| age | 15≤ | 11 | 2.4 |
| 16-44 | 37 | 14.2 | |
| 45-73 | 91 | 35 | |
| ≥ 74 | 121 | 46.5 | |
| gender | Male | 152 | 58.5 |
| Female | 108 | 41.5 | |
| marital status | Married | 165 | 63.5 |
| Single | 31 | 11.9 | |
| Divorced | 7 | 2.7 | |
| Widowed | 57 | 21.9 | |
| Education level | Illiterate | 167 | 64.2 |
| Below High School | 52 | 20 | |
| High School Diploma | 29 | 11.2 | |
| University | 12 | 4.6 | |
| Income (Million toman) |
< 2.5 | 95 | 36.5 |
| 2.5-5 | 84 | 32.3 | |
| 5-7.5 | 62 | 23.8 | |
| > 7.5 | 19 | 7.3 | |
| Employee | 10 | 3.8 | |
| job | Retired | 13 | 5 |
| Self-employed | 87 | 33.5 | |
| Worker | 120 | 46.2 | |
| Unemployed | 30 | 11.5 | |
Regarding education, 167 individuals (64.2%) were illiterate, whereas 52 (20%) had completed a maximum of six years of schooling. In contrast, 29 (11.2%) held a high school diploma, and only 12 (4.6%) pursued higher education. Laborers represented the largest occupational group, accounting for 46.2% (120 cases) of the total deaths. Additionally, 51.9% (135 individuals) of the deceased had an income of less than 2.5 million Tomans.
Mortality Trends (2015 – 2019)
The crude mortality rate per 100,000 population in Showt County fluctuated between 2015 and 2019. In 2015, the rate was 582, which dropped to 492 in 2016. However, it increased to 515 in 2017, then decreased slightly to 512 in 2018, and rose again to 530 in 2019. Although the crude mortality rate was highest in 2015, the highest number of deaths occurred in 2019, accounting for 29.6% of the total deaths, while the lowest percentage of deaths was recorded in 2015 (10.8 %) (Table 2).
Table 2: Mortality Status in Shoot County during the years 2015-2019.
| Year | Population | Number of Deaths | Crude Mortality Rate per 100,000 Population |
| 2015 | 55,700 | 324 | 582 |
| 2016 | 55,682 | 274 | 492 |
| 2017 | 56,337 | 290 | 515 |
| 2018 | 57,000 | 292 | 512 |
| 2019 | 60,000 | 318 | 530 |
Dietary Habits of the Deceased
Among the deceased, 42.7% (111 cases) consumed pasteurized dairy products, while 57.3% (149 cases) consumed locally produced dairy products. The majority (68.5% [178 cases]) preferred Barbari bread, with only 4.6% (12 cases) consuming Sangak bread daily. Liquid oil was used by 75.8% (197 cases), whereas 13.5% (35 cases) used local oil and 10.8% (28 cases) used vegetable oil. Additionally, 58.1% (151 cases) of the deceased consumed red meat and chicken twice a week. A significant portion of the deceased (36.9%) had consumed fast food, while only 13.1% had a history of coffee consumption (Table 3).
Among the deceased, 42.7% (111 cases) consumed pasteurized dairy products, while 57.3% (149 cases) consumed locally produced dairy products. The majority (68.5% [178 cases]) preferred Barbari bread, with only 4.6% (12 cases) consuming Sangak bread daily. Liquid oil was used by 75.8% (197 cases), whereas 13.5% (35 cases) used local oil and 10.8% (28 cases) used vegetable oil. Additionally, 58.1% (151 cases) of the deceased consumed red meat and chicken twice a week. A significant portion of the deceased (36.9%) had consumed fast food, while only 13.1% had a history of coffee consumption (Table 3).
Table 3: Frequency distribution of dietary habits of the deceased in Shoot County during the years 2015-2019.
| Kind of food | Count | percentage | |
| dairy products | pasteurized | 111 | 42.7 |
| local | 149 | 57.3 | |
| bread | lavash | 70 | 26.9 |
| stone | 12 | 4.6 | |
| barbarism | 178 | 68.5 | |
| Consumable oil | Liquid | 197 | 75.8 |
| Solid | 28 | 10.8 | |
| Local | 35 | 13.5 | |
| Meat consumption per week (meals) | 0 | 6 | 2.3 |
| 1 | 27 | 10.4 | |
| 2 | 151 | 58.1 | |
| 3 | 58 | 22.3 | |
| 4 | 18 | 6.9 | |
| Kind of meat consumption | Red Meat | 5 | 1.9 |
| Chicken | 20 | 7.7 | |
| Both | 229 | 88.1 | |
| Neither | 6 | 2.3 | |
| Fish and canned fish consumption per week (meals) | 0 | 114 | 43.8 |
| 1 | 139 | 53.5 | |
| 2 | 6 | 2.3 | |
| 3 | 1 | 0.4 | |
| Iodized salt consumption per week (meals) | 0 | 2 | 0.8 |
| 1 | 16 | 6.2 | |
| 2 | 60 | 23.1 | |
| 3 | 100 | 38.5 | |
| 3< | 84 | 32.3 | |
| vegetable consumption per week (meals) | 0 | 1 | 0.4 |
| 1 | 127 | 48.8 | |
| 2 | 78 | 30 | |
| 3 | 40 | 15.4 | |
| 3< | 14 | 5.4 | |
| Nuts and seeds consumption per week (meals) | 0 | 184 | 70.8 |
| 1 | 73 | 28.1 | |
| 2 | 3 | 1.2 | |
| Eating fast food | Yes | 96 | 36.9 |
| No | 164 | 63.1 | |
| coffee | Yes | 34 | 13.1 |
| No | 226 | 86.9 | |
Causes of Death
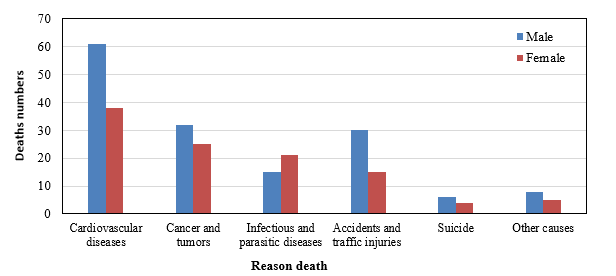
According to the study, 73.8% of deaths were due to underlying health conditions, with cardiovascular disease being the leading cause (38.1 %). In 6.9% of the cases, a family history of death from cardiovascular disease was identified (Figure 2).
According to the study, 73.8% of deaths were due to underlying health conditions, with cardiovascular disease being the leading cause (38.1 %). In 6.9% of the cases, a family history of death from cardiovascular disease was identified (Figure 2).
Figure 2: Frequency distribution of causes of death among the studied individuals by cause and gender in Shoot County during the years 2015-2019.
Environmental Factors
Regarding environmental factors, 97.7% of the deceased were aware of the safety and quality of the water they consumed, and 88.5% reported no significant changes in the water quality throughout the year. All individuals had access to clean water for hygiene purposes, and proper sewage disposal systems were in place in their homes. Notably, 94.2% of the deceased were not exposed to chemical or dust pollution in their workplaces, and only 20.8% had contact with soil through ingestion, inhalation, or skin contact. Furthermore, all deceased individuals had access to temporary waste storage containers, and none used insecticides at home or in their workplaces (Table 4).
Regarding environmental factors, 97.7% of the deceased were aware of the safety and quality of the water they consumed, and 88.5% reported no significant changes in the water quality throughout the year. All individuals had access to clean water for hygiene purposes, and proper sewage disposal systems were in place in their homes. Notably, 94.2% of the deceased were not exposed to chemical or dust pollution in their workplaces, and only 20.8% had contact with soil through ingestion, inhalation, or skin contact. Furthermore, all deceased individuals had access to temporary waste storage containers, and none used insecticides at home or in their workplaces (Table 4).
Table 4: Frequency distribution of environmental factors among deceased individuals in Showt County during the years 2015-2019.
| Factor | Response | Number | Percentage |
| Safe water quality | Yes | 254 | 97.70% |
| No | 6 | 2.30% | |
| Witnessed sudden changes in water quality parameters |
Yes | 30 | 11.50% |
| No | 230 | 88.50% | |
| Access to clean and sanitary water in place of residence |
Yes | 260 | 100% |
| No | 0 | 0% | |
| Proper sewage disposal maintenance using absorption wells |
Yes | 260 | 100% |
| No | 0 | 0% | |
| Presence of dust and chemical pollution in the living environment |
Yes | 15 | 5.80% |
| No | 245 | 94.20% | |
| Exposure to soil through ingestion, inhalation, and skin contact |
Yes | 54 | 20.80% |
| No | 206 | 79.20% | |
| Adequate waste storage containers for the amount of waste produced in the city |
Yes | 260 | 100% |
| No | 0 | 0% | |
| Use of insecticides according to instructions in home and work place Safe water quality |
Yes | 0 | 0% |
| No | 260 | 100% |
Lifestyle Factors
One notable finding of the study was that only 0.4% (1 individual) among the deceased regularly visited a doctor. In contrast, 57.7% (150 individuals) reported sleeping for 7-8 hours per night and waking up refreshed. None of the deceased regularly engaged in weekly exercise or muscle-strengthening activities. While 18.5% (48 cases) reported consistently managing stress, 60.8% (158 cases) refrained from unprescribed medication use. Smoking was prevalent among 51.9% (135 individuals), but 96.9% (252 cases) of the deceased avoided drug and alcohol use. Surprisingly, 51.9% (135 cases) of the deceased did not follow traffic rules while driving
(Table 5).
Table 5: Frequency distribution of the lifestyle of deceased individuals in Showt County during the years 2015-2019.
| Factor | Response | Number | percentage |
| Regular doctor visits | Never | 8 | 3.10% |
| Rarely | 89 | 34.20% | |
| Sometimes | 141 | 54.20% | |
| Often | 21 | 8.10% | |
| Always | 1 | 0.40% | |
| Getting enough sleep (at least 7-8 hours) and waking up refreshed |
Never | 1 | 0.40% |
| Rarely | 2 | 0.80% | |
| Sometimes | 45 | 17.30% | |
| Often | 150 | 57.70% | |
| Always | 62 | 23.80% | |
| Regular exercise and muscle strengthening weekly | Never | 83 | 31.90% |
| Rarely | 135 | 51.90% | |
| Sometimes | 41 | 15.80% | |
| Often | 1 | 0.40% | |
| Always | 0 | 0% | |
| Stress management and control | Never | 4 | 1.50% |
| Rarely | 6 | 2.30% | |
| Sometimes | 85 | 32.70% | |
| Often | 117 | 45.00% | |
| Always | 48 | 18.50% | |
| Avoiding unprescribed and excessive use of medication |
Never | 0 | 0% |
| Rarely | 5 | 1.90% | |
| Sometimes | 81 | 31.20% | |
| Often | 158 | 60.80% | |
| Always | 16 | 6.20% | |
| Smoking | Never | 28 | 10.80% |
| Rarely | 24 | 9.20% | |
| Sometimes | 30 | 11.50% | |
| Often | 43 | 16.50% | |
| Always | 135 | 51.90% | |
| Following traffic rules while driving | Never | 120 | 46.20% |
| Rarely | 60 | 23.10% | |
| Sometimes | 37 | 14.20% | |
| Often | 11 | 4.20% | |
| Always | 6 | 2.30% | |
| Did not drive | 26 | 10.00% |
Discussion
The findings of this study reflect several critical factors influencing mortality trends in Showt County from 2015 to 2019. A significant proportion of the deceased were elderly individuals, reflecting global patterns where age is a primary determinant of mortality. The high prevalence of cardiovascular disease as the leading cause of death aligns with other studies showing non-communicable diseases, particularly heart disease, as a major contributor to mortality worldwide 20. This is exacerbated by lifestyle factors such as smoking, poor dietary habits, and lack of physical activity observed among the deceased 21. According to the reports of the National and Subnational Burden of Diseases, Injuries, and Risk Factors (NASBOD) in Iran, cardiovascular diseases, diabetes and kidney diseases,. cancer, and chronic respiratory diseases were the four leading causes of death in 2015 among non-communicable diseases, which is consistent with the findings of the present study 19, 22. The 2017 Global Burden of Disease (GBD) study also indicates that the leading causes of non-communicable diseases and mortality were cardiovascular diseases, cancers, diabetes and kidney disorders, as well as neurological conditions 23, 24.
Environmental factors, such as access to clean water and the absence of workplace pollution, are generally favorable in Showt County. However, lifestyle choices, including low physical activity, smoking, and non-compliance with traffic rules, pose significant public health concerns. These behaviors are linked to increased mortality, as observed in the study. In previous studies, physical inactivity and water and air pollution have been identified as major risk factors for non-communicable diseases (NCDs). This pollution has had a direct impact on human health 25, 26.
The fluctuation in mortality rates over the study period suggests the influence of various external factors, including socioeconomic conditions, healthcare access, and possibly environmental changes. The decline in mortality rates after 2015 may indicate improvements in healthcare or living conditions, although the rise in 2019 requires further investigation to understand the potential causes.Based on studies conducted from 1990 to 2017, a strong correlation has been shown between mortality rates, the quality of healthcare, and the quality of public health infrastructure, with the incidence rate being linked to socio-economic indicators 27. A study conducted in the United States from 1990 to 2016 showed that social and economic factors had a direct impact on mortality rates. The highest increase in mortality was observed among working-age adults (ages 25 to 64) with lower levels of education 28.
This study highlights the importance of addressing both lifestyle and environmental factors to improve public health outcomes. Promoting healthier behaviors, such as increased physical activity, stress management, and adherence to medical advice, alongside maintaining a clean environment, could significantly reduce mortality rates in Showt County.
To prevent cardiovascular disease (CVD), adopting a healthy lifestyle involves making dietary adjustments, such as increasing vegetable and fruit intake, lowering salt consumption, and controlling fat and oil intake. The metabolic risk factors for CVD include hypertension, obesity, diabetes, and high cholesterol levels. Urbanization and technological advancements have contributed to modern lifestyles, leading to a increase in CVD, highlighting the need for increased physical activity.
Moreover, alcohol consumption, smoking, and stress management are recognized as key risk factors for CVD. Barriers to maintaining a healthy lifestyle include personal factors such as limited skills, structural issues such as lack of physical activity facilities, and social influences, including cultural norms and peer pressure. Key strategies to overcome these barriers include education, personal commitment, and receiving support from family and the community 29, 30.
According to the findings of this study and the results of other research, the presence of certain risk factors, such as poor nutrition, living in polluted environments, and physical inactivity, can lead to various non-communicable diseases. However, these findings involve some uncertainty and may be subject to underestimation or overestimation, indicating the need for further studies.
Suggestions
- Encourage Healthy Dietary Habits: Promote the consumption of vegetables and fruits, reduce salt intake, and control the use of fats and oils to prevent cardiovascular disease (CVD).
- Address Metabolic Risk Factors: Implement programs to manage metabolic risk factors, such as hypertension, obesity, diabetes, and high cholesterol, which are linked to CVD.
- Increase physical activity: Given the rise in CVD due to urbanization and modern lifestyles, promoting regular physical activity is essential for preventing non-communicable diseases (NCDs).
- Promoting smoking cessation: As 51.9% of the deceased individuals were smokers, promoting smoking cessation could significantly reduce the risk of CVD and other NCDs.
- Improving Stress Management: Encourage stress management techniques and provide resources, as stress is a recognized risk factor for CVD and other health issues.
- Enhancing health literacy: Providing education to improve health literacy, especially among individuals with lower educational attainment, which has been linked to higher mortality rates.
- Improve Access to Healthcare: Increase access to regular healthcare services, as only 0.4% of the deceased regularly visited a doctor, and promote the importance of preventive medical check-ups.
- Promote Road Safety: Advocate for adherence to traffic rules, as 51.9% of the deceased did not follow traffic regulations, which contributed to increased mortality.
- Encourage compliance with medical advice: Support initiatives that encourage the use of prescribed medications and adherence to medical advice, which could lower preventable deaths.
- Support Environmental Health Measures: Continue providing access to clean water and maintain proper waste disposal and sewage systems, as these environmental factors positively impact public health outcomes.
Conclusion
This study highlights the complex interplay of socioeconomic, environmental, and lifestyle factors influencing mortality in Showt زity, West Azerbaijan, from 2015 to 2019. Cardiovascular disease was the leading cause of death (38.1%), with smoking (51.9%), physical inactivity (100%), illiteracy (64.2%), and unhealthy dietary habits as the major contributing risk factors.
Although environmental conditions, such as access to safe water and sewage systems, are generally favorable, modifiable lifestyle factors remain a significant concern. These findings provide important local evidence for health policymakers to design targeted interventions focusing on smoking cessation, the promotion of physical activity, healthy nutrition, and improved health literacy. Future studies should investigate the causal relationships between these risk factors and mortality to support more effective public health strategies in the region.
Acknowledgment
The authors would like to thank the authorities at the Urmia University University of Medical Sciences for their financial support.
Conflict of Interest
There are no conflicts of interest to declare.
Funding
Supported by the Urmia university of Medical sciences, (Grant No. 12600).
Ethical Considerations
This study was approved by the Ethics Committee of Urmia University of Medical Sciences.
Code of Ethics
The ethical code of the current study was IR.UMSU.REC.1402.274.
Author contributions
Amir Mohammadi, Majid Babaei and Ebrahim Mohammadi: Methodology, Formal analysis, Writing – original draft, Writing – review & editing. Bahram Naeimi and Erfan Qolizadegan: data collection. Shila Hasanzadeh: design study and statistical analysis. Sima Deghani: Investigation and Methodology..
This is an Open-Access article distributed in accordance with the terms of the Creative Commons Attribution (CC BY 4.0) license, which permits others to distribute, remix, adapt, and build upon this work for commercial use.
References
1. Kruk ME, Gage AD, Arsenault C, et al. High-quality health systems in the Sustainable Development Goals era: time for a revolution. The Lancet global health. 2018;6(11):e1196-e252.
2. Zhu Y, Bashir S, Marie M. Assessing the relationship between poverty and economic growth: does sustainable development goal can be achieved? Environmental Science and Pollution Research. 2022;29(19):27613-23.
3. Baciu A, Negussie Y, Geller A, et al. The root causes of health inequity. Communities in action: Pathways to health equity: National Academies Press (US); 2017.
4. Nikonahad A, Khorshidi A, Ghaffari HR, et al. A time series analysis of environmental and metrological factors impact on cutaneous leishmaniasis incidence in an endemic area of Dehloran, Iran. Environmental Science and Pollution Research. 2017;24:14117-23.
5. Rahman MM, Rana R, Khanam R. Determinants of life expectancy in most polluted countries: Exploring the effect of environmental degradation. PloS one. 2022;17(1):e0262802.
6. Rocco L, Fumagalli E, Mirelman AJ, et al. Mortality, morbidity and economic growth. Plos one. 2021;16(5):e0251424.
7. Amar S, Pratama I. Exploring the link between income inequality, poverty reduction and economic growth: An ASEAN perspective. International Journal of Innovation, Creativity and Change. 2020;11(2):24-41.
8. Balasubramanian P, Burchi F, Malerba D. Does economic growth reduce multidimensional poverty? Evidence from low-and middle-income countries. World Development. 2023;161:106119.
9. Jian Y, Messer LC, Jagai JS, et al. Associations between environmental quality and mortality in the contiguous United States, 2000–2005. Environmental health perspectives. 2017;125(3):355-62.
10. Chan KS, Roberts E, McCleary R, et al. Community characteristics and mortality: the relative strength of association of different community characteristics. American journal of public health. 2014;104(9):1751-8.
11. Jeong C-U, Leiby JS, Kim D, et al. Artificial intelligence-driven biological age prediction model using comprehensive health checkup data: development and validation study. JMIR aging. 2025;8(1):e64473.
12. Babaie M. The effect of health indicators and macroeconomic variables on the level of life expectancy: comparison of developing and developed countries with the panel data approach. Studies in Medical Sciences. 2020;31(7):568-75.
13. Delavari S, Zandian H, Rezaei S, et al. Life Expectancy and its Socioeconomic Determinants in Iran. Electron Physician. 2016;8(10):3062-8.
14. Ebrahimi N, Mehdipour P, Mohebi F, et al. Improved population health in Iran from 1979 to 2019; decreasing mortality rates and increasing life expectancy. Arch Iran Med. 2020;23(2):61-8.
15. Ward JL, Azzopardi PS, Francis KL, et al. Global, regional, and national mortality among young people aged 10–24 years, 1950–2019: a systematic analysis for the Global Burden of Disease Study 2019. The Lancet. 2021;398(10311):1593-618.
16. Kraay A. Methodology for a World Bank human capital index. World Bank Policy Research Working Paper. 2018(8593).
17. Wang M. Health indicators on adolescents reveal disparity and inequality on regional and national levels. BMC Public Health. 2021;21(1):1006.
18. Kottek M, Grieser J, Beck C, et al. World map of the Köppen-Geiger climate classification updated. 2006.
19. Babaei M, Pirnejad H, Rezaie J, et al. Association between socioeconomic factors and the risk of gastric cancer incidence: results from an ecological study. Iran J Public Health. 2023;52(8):1739.
20. Roth GA, Mensah GA, Johnson CO, et al. Global burden of cardiovascular diseases and risk factors, 1990–2019: update from the GBD 2019 study. J Am Coll Cardiol. 2020;76(25):2982-3021.
21. van Assen MA, Helmink JH, Gobbens RJ. Associations between lifestyle factors and multidimensional frailty: a cross-sectional study among community-dwelling older people. BMC Geriatr. 2022;22:1-13.
22. The National and Subnational Burden of Diseases. Injuries, and Risk Factors (NASBOD) [Internet]. Tehran: NCDRC, Tehran University of Medical Sciences; 2015. Available from : https://vizit.report/en/dashboard.htm [cited Dec 14, 2015].
23. Afshin A, Sur PJ, Fay KA, et al. Health effects of dietary risks in 195 countries, 1990–2017: a systematic analysis for the Global Burden of Disease Study 2017. The Lancet. 2019;393(10184):1958-72.
24. Rezaei S, Babaei M. A systematic literature review on direct and indirect costs of triple-negative breast cancer. Cost Eff Resour Alloc. 2023;21(1):92.
25. Tainio M, Andersen ZJ, Nieuwenhuijsen MJ, et al. Air pollution, physical activity and health: a mapping review of the evidence. Environ Int. 2021;147:105954.
26. Cunningham GB, Wicker P, McCullough BP. Pollution, health, and the moderating role of physical activity opportunities. Int J Environ Res Public Health. 2020;17(17):6272.
27. Ursache SA, Gabor VR, Muntele I, et al. Mortality trends by causes of death and healthcare during a period of global uncertainty (1990–2017). InHealthcare 2021;9(6):748. MDPI.
28. Becker T, Majmundar MK, Harris KM, et al. National Academies of Sciences, Engineering, and Medicine, Committee on Population. The Relationship Between Economic Factors and Mortality. High and Rising Mortality Rates Among Working-Age Adults: National Academies Press (US); 2021.
29. Ndejjo R, Musinguzi G, Nuwaha F, et al. Understanding factors influencing uptake of healthy lifestyle practices among adults following a community cardiovascular disease prevention programme in Mukono and Buikwe districts in Uganda: a qualitative study. PLoS One. 2022; 17(2):e0263867.
30. Vilchez-Chavez AF, Bernal Altamirano E, Morales-García WC, et al. Healthy habits factors and stress associated with health-related quality of life in a Peruvian adult population: a cross-sectional study. J Multidiscip Healthc. 2023:2691-700.
Type of Study: Original articles |
Subject:
Epidemiology
Received: 2026/05/15 | Accepted: 2026/07/20 | Published: 2026/09/10
Received: 2026/05/15 | Accepted: 2026/07/20 | Published: 2026/09/10
Send email to the article author
| Rights and permissions | |
 |
This work is licensed under a Creative Commons Attribution-NonCommercial 4.0 International License. |