

Volume 10, Issue 4 (December 2025)
J Environ Health Sustain Dev 2025, 10(4): 2825-2842 |
Back to browse issues page


Download citation:
BibTeX | RIS | EndNote | Medlars | ProCite | Reference Manager | RefWorks
Send citation to:


BibTeX | RIS | EndNote | Medlars | ProCite | Reference Manager | RefWorks
Send citation to:
P. Dehankar S, R. Joshi R. Ultrasonic-Assisted Degradation of Metformin from Pharmaceutical Effluent: Process Optimization via Response Surface Methodology. J Environ Health Sustain Dev 2025; 10 (4) :2825-2842
URL: http://jehsd.ssu.ac.ir/article-1-1027-en.html
URL: http://jehsd.ssu.ac.ir/article-1-1027-en.html


Department of Chemical Engineering, Dr. Vishwanath Karad MIT World Peace University, Pune–411038, Maharashtra, India
Keywords: Metformin, Drug Stability, Ultrasonic, Wastewater, Water Purification, Statistical models.
Full-Text [PDF 664 kb]
(120 Downloads)
| Abstract (HTML) (503 Views)
.JPG)
Figure 1: Ultrasonic Experiment Setup.
COD Removal % = β 0 + β 1 X 1 + β 2 X 2 + β 3 X 3 + β 4 X 4 + β 5 X 5 + β ij X i X j + β ii X i '
The Response Surface Methodology successfully developed a quadratic polynomial regression model for COD removal efficiency, demonstrating excellent predictive capability. The model exhibited an R² value of 96.42%, indicating that 96.42% of the variance in COD removal was explained by the five independent variables and their interactions. The adjusted R² of 94.88% remained close to the R² value, confirming the appropriate model complexity without overfitting. Cross-validation yielded a predicted R² of 91.53%, well within the recommended 20% threshold of the adjusted R², thereby confirming a robust predictive capability. The standard error of 2.87% represents a typical prediction error, indicating high precision in the model estimates.
Figure 2 shows the normal probability plot of residuals of the model of removal of COD. The residual plots are close to a straight line, which means that the assumption of the normal distribution is well met. This establishes that the regression model is fitting the experimental data pretty well and that there exists no significant deviation on the basis of non-normality of errors. The fact that strong curvature or outliers are absent is another strong indication that the model predictions show statistically reliable results and can be used in response surface analysis and optimization.
.JPG)
Figure 2: COD model - Normal probability plot of residuals.
.JPG)
Figure 3: COD model - Residuals vs. fitted values plot.
.JPG)
Figure 4: COD model - Residuals vs. order plot.
.JPG)
Figure 5: TOC model - Normal probability plot of residuals.
.JPG)
Figure 6: TOC model - Residuals vs. fitted values plot.
.JPG)
.JPG)
Figure 8: COD model Pareto Chart- Main effects plot for all five parameters.
.JPG)
Figure 9: TOC model Pareto Chart- Main effects plot for all five parameters.
.JPG)
Figure 10: Contour Plot: Effect of pH and Power on COD Removal.
.JPG)
Figure 11: 3D Surface Plot: Effect of Ultrasonic Power and H₂O₂ Dose on TOC Removal.
.JPG)
Figure 12: Contour Plot: Effect of H₂O₂ Dose and Metformin Concentration on TOC Removal.
.JPG)
Figure 13: 3D Surface Plot: COD Removal versus Power and pH.
Table 4: Model Predictions and Experimental Validation Results
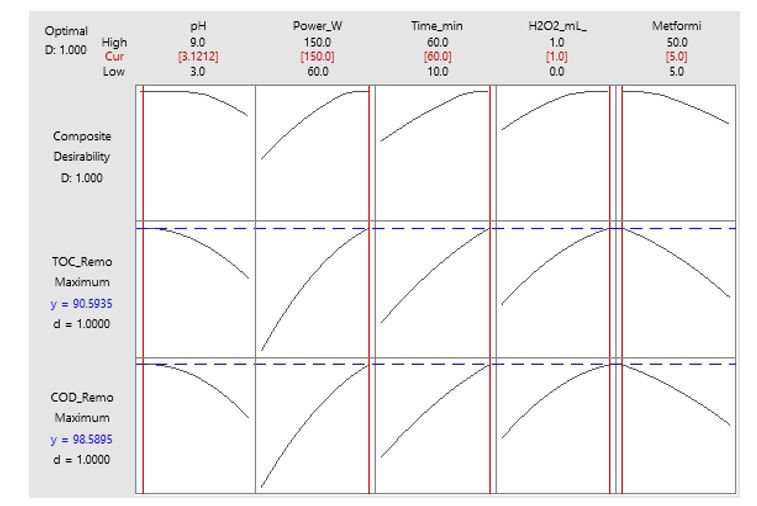
Figure 14: Optimisation Plot: Multi-Response Desirability Function.
The critical considerations for assessing the feasibility of ultrasonic-assisted degradation systems are energy efficiency and scalability. According to previous research on ultrasonic reactors10,13, the density of cavitation, heat dissipation, and effectiveness of acoustic transmission are among the strongest influencing factors of energy consumption. In the ideal scenario of this study, the energy requirements were comparable to those of other radical-based AOPs, including ozone treatment and UV/H2O21, even without the formation of sludge or the presence of a catalyst. Nonetheless, as observed by Tang et al. (2019) and Radjenovic et al. (2007), when the laboratory is switched to pilot-scale operation, reactor geometry, bubble cloud shielding, and temperature control should be considered18,19. The scalability of probe-type ultrasonic systems has been shown to be inherent in prior studies13, but will require perfect coupling of the energy and better continuous-flow reactor designs to create full-scale naivety on cavitation and radical utilization.
The ultrasonic-aided method has been found to possess unique environmental benefits, such as zero generation of chemical sludges, the absence of catalysts, and ambient operation temperature, which makes it an environmentally friendly technology10,20. Validated predictive models allow the design of a rational process, cost-efficiently, and to be sure of the scale-up to an industrial level of pharmaceutical wastewater treatment applications16,19. The comparative prospects show high efficiency at the same level as fine AOPs, such as electro-Fenton and ozonation, and practical characteristics in terms of sustainability and scalability1. This technology shows good integration with current wastewater treatment plants and presents the possibility of retrofitting municipal and industrial plants18.
The introduction of ultrasonic-assisted degradation into laboratories should be followed by pilot and full-scale tests, taking into account the hydrodynamics of the reactor, its continuous-flow arrangement, and the stability of its operation. As pointed out in previous wastewater treatment scale-up tests, pilot-scale testing is required to investigate the number of fouling behaviours, energy-saving at variable loads, and relationship with complex real wastewater matrices18,19. Although the scalability of cavitation-driven systems has been promising in the past with the help of ultrasonic research, an important engineering challenge is to achieve a homogeneous cavitation intensity in large reactor volumes10,13. Real-scale scaling will thus be based on optimized probe placement, improved cooling systems, and controls in energy distribution to ensure that the radical generation efficiency in bench experiments is achieved on a large scale. Existing treatment plants might be integrated as a polishing or pre-oxidation stage, which will have to be proven in a long-term operation with continuous-flow mode to determine long-term performance and industrial feasibility.
This is an Open-Access article distributed in accordance with the terms of the Creative Commons Attribution (CC BY 4.0) license, which permits others to distribute, remix, adapt, and build upon this work for commercial use.
Full-Text: (109 Views)
Ultrasonic-Assisted Degradation of Metformin from Pharmaceutical Effluent: Process Optimization via Response Surface Methodology
Shital P. Dehankar 1,Ratnadip R. Joshi 1*
¹ Department of Chemical Engineering, Dr. Vishwanath Karad MIT World Peace University, Pune–411038, Maharashtra, India.
Shital P. Dehankar 1,Ratnadip R. Joshi 1*
¹ Department of Chemical Engineering, Dr. Vishwanath Karad MIT World Peace University, Pune–411038, Maharashtra, India.
| A R T I C L E I N F O | ABSTRACT | |
| ORIGINAL ARTICLE | Introduction: Metformin, an extremely prescribed antidiabetic medication, is discharged with minimal or no processing and remains during the usual wastewater treatment procedures. Advanced oxidation processes (AOP), especially ultrasound-enabled oxidation, are catalyst- and sludge-free reaction pathways for degrading recalcitrant pharmaceuticals. This study aimed to (i) determine the ultrasound-assisted degradation of metformin using hydrogen peroxide, (ii) determine the effect of the main operation parameters, and (iii) optimize the chemical oxygen demand (COD) and total organic carbon (TOC) using Response Surface Methodology (RSM). Materials and Methods: Five process parameters were optimized: pH (3-9), ultrasonic power (60-150 W), sonication time (10-60 min), H₂O₂ concentration (0-1.0 mL/L), and initial metformin concentration (5-50 mg/L). Dual response variables, including COD and TOC removal, were analyzed via quadratic polynomial regression. Metformin concentration was quantified using high-performance liquid chromatography at a detection wavelength of 240 nm. Results: Optimal operating conditions were identified as pH 3.5, ultrasonic power 110 W, sonication time 40 min, and H₂O₂ concentration 0.65 mL/L, achieving 94.5% COD removal, 88.3% TOC removal, and 97.2% metformin degradation. Both statistical models demonstrated high significance (p < 0.0001) with a coefficient of determination R² > 0.96 and a composite desirability of 0.9845 (98.45%), confirming excellent multi-response optimization. Conclusion: Metformin significantly reduced the organic load, and the drug was significantly degraded by ultrasonic-assisted oxidation. The optimization method based on RSM offers predictive models that can be used to design the process or the performers. |
|
Article History: Received: 21 August 2025 Accepted: 20 October 2025 |
||
*Corresponding Author: Ratnadip R. Joshi Email: ratnadip.joshi@mitwpu.edu.in Tel: +91 9423332754 |
||
Keywords: Metformin; Drug Stability; Ultrasonic; Wastewater; Water Purification; Statistical models. |
Citation: Shital P. Dehankar, Ratnadip R. Joshi. Ultrasonic-Assisted Degradation of Metformin from Pharmaceutical Effluent: Process Optimization via Response Surface Methodology. J Environ Health Sustain Dev. 2025; 10(4): 2825-42.
Introduction
Pharmaceutical Pollutants and Metformin Contamination
Emerging pharmaceutical pollutants in aquatic ecosystems are a critical global environmental issue, as pharmaceuticals and personal care products (PPCPs) have been increasingly found in aquatic environments worldwide1,2. Metformin, the first-line drug used in the treatment of type 2 diabetes mellitus, engages more than 360 million patients in the world and is one of the most widely used drugs2,3,4. Increases in consumption are alarming, and in developed countries such as Germany, the consumption of the antidiabetic metformin has tripled over the past 10 years, with the compound being the most detected pharmaceutical in municipal wastewater5,6.
The metabolic properties of metformin are unique because they render metformin environmentally persistent. Unlike most drugs, approximately 90% of oral metformin is eliminated unchanged in urine and feces, with only a small amount of metabolic modification in the human body1,2. Consequently, metformin has been found in different aquatic compartments at concentrations ranging from 3.5 to 88 ug/l in municipal wastewater and 0.01 to 2.5 ug/l in surface waters, as well as at trace concentrations in groundwater and drinking water sources2,5,7. In addition, the chemical stability of the biguanide structure of metformin makes it an extremely resistant compound to natural degradation processes, which is why it is widely found in the environment6.
The effects of metformin contamination on aquatic ecosystems extend from one trophic level to the next. Toxicological studies have shown major negative effects on fish species, such as oxidative stress, genotoxicity, disruption of intestinal microbiota, and morphological modification2,4,8. Of concern is the ability of metformin to cause intersex disorders, along with its ability to induce intersex disorders in male fathead minnows (Pimephales promelas) at environmentally relevant concentrations (40 µg/L), suggesting endocrine-disrupting properties 4. It also suppresses the number of eggs in females, and the compound leads to developmental defects in fish embryos and larvae8. Studies on Daphnia and rotifers exposed to metformin have reported significant impacts on growth, fecundity, and population dynamics, indicating that metformin can disrupt the demographic structure of these aquatic species2. Metformin has demonstrated in bioaccumulation studies that it can reach tissue concentrations higher than 3000 μg g-1 in the exposed organisms and has at least caused the concern of its biomagnification in aquatic food chains2.
The monolayer treatment systems of conventional biological wastewater treatment plants show an insufficient capacity for metformin elimination, with activated sludge processes having an elimination efficiency of 20-40%1,7. The biguanide molecule structure shows poor biodegradability, and it is not possible for microbiological consortia in biological treatment systems to be effective in its mineralization5,6. It was found that the conventional wastewater treatment efficiencies varied between 22 per cent and 99 per cent at different wastewater treatment establishments and thus, the performance of conventional wastewater treatment is inconsistent7. Failure of this treatment leads to the extended release of metformin into receiving waters, making effluents from wastewater treatment plants the key source of contamination2. With the development of emerging drug compounds, regulations are increasing, and water quality standards are shifting towards achieving pharmaceutical discharge, requiring advanced treatment technologies that can achieve overall pharmaceutical removal and mineralization 7,9.
Advanced Oxidation Processes for Metformin Degradation
Advanced oxidation processes (AOPs) are a group of effective water treatment technologies based on the formation of highly reactive hydroxyl radicals (- OH) with an oxidation potential of E⁰ = 2.8 V, which permit non-selective mineralization of recalcitrant organic pollutants 2,10. Comparative performance data of various AOPs show a large variability in the rate of metformin degradation. Electro-Fenton processes have proven to have incredible removal rates, with 98.57% in 10m while ozonation results in complete (100%) removal in 30-45m1. In general, photocatalytic systems with TiO₂ catalysts have efficiencies of 74-82% in the process in times ranging–60-120 minutes, while the UV/ H₂O₂ processes have been reported to have a 99.9% removal efficiency in 45-60 minutes11,12.
Ultrasonic-assisted degradation is based on acoustic cavitation, which involves the formation, growth, and violent collapse of microbubbles that usually operate at frequencies ranging from 20-40 kHz10,13. The implosion of these cavitation bubbles creates extreme localized conditions with temperatures over 5000 kelvins and pressures over 1000 atm, producing reactive hotspots favorable for chemical transformation10,13. Radical generation occurs via multiple pathways, including water sonolysis and enhanced H₂O₂ decomposition10. A synergistic combination of ultrasonic treatment with chemical oxidants, known as sono-oxidation, shows two-to three-fold improvement in degradation efficiency over ultrasonic treatment alone13,14.
Environmental benefits of ultrasonic processes include the production of zero chemical sludges, the absence of catalysts, operation at ambient temperature, and the scalability of reactor design10,13. However, there are some shortcomings, including higher energy consumption than biological processes, severe heat dissipation problems that require the use of active cooling systems, and a lack of industrial nucleation data at full production scale13.
Research Gap and Study Objectives
Despite the increasing interest in ultrasonic degradation technologies, systematic optimization studies using a rigorous statistical design of experiments to determine the effect of technological factors on metformin removal are still lacking1,15,16. Most of the published literature is based on single-response optimization, and there is not much dual-response optimization data for simultaneous maximization of COD and TOC removal1. There is a critical gap in terms of validated predictive models that are suitable for industrial scale-up and comprehensive process economic evaluation16,17. In addition, a lack of knowledge on complex parameter interactions influencing treatment efficiency prevents the rational design of processes13,16.
This research project addresses these gaps in knowledge using the following specific research objectives:
This research project addresses these gaps in knowledge using the following specific research objectives:
- Predictive quadratic polynomial regression models were developed for COD and TOC removal using Response Surface Methodology (RSM).
- The five key process parameters, namely pH, ultrasonic power, sonication time, H₂O₂ dose, and initial metformin concentration, were optimized using a Central Composite Design to identify the optimal operating conditions.
- The significant parameter interactions were determined, and their synergistic or antagonistic effects on metformin degradability were evaluated through systematic statistical analysis.
- Perform multi-objective optimization of COD and TOC removal using desirability functions to identify the globally optimal treatment conditions.
- The model predictions were validated through confirmatory experiments under optimum conditions, and the feasibility of applying the optimized ultrasonic process to pharmaceutical wastewater treatment was assessed.
Novelty of Research
Contrary to earlier studies on metformin degradation, which mainly focused on the optimization of single-response or became dependent on special advanced oxidation processes such as electro-Fenton, photocatalysis, or UV/H2O21,11, this study is the first to present a dual-response (COD and TOC) optimization of ultrasonic-assisted past sono-oxidation studies that have not quantitatively measured multi-parameter interactions or simulated their joint impact on mineralization efficiency10,13. This study presents a statistically tested quadratic model that can be used to concurrently predict COD and TOC removal with high accuracy (R² greater than 0.95), demonstrating important synergistic interactions between pH, ultrasonic power, and dosage of H₂O₂. Moreover, this study provides a new mechanistic interpretation with experimental tendencies and the most efficient working windows for rapid metformin mineralization, and presents a scale of opportunities for ultrasonic application in pharmaceutical wastewater treatment. The dual-response modelling in combination with the profound mechanistic understanding and sono-Fenton optimization technique considerably improves the current literature on metformin degradation by AOPs.
Materials and Methods
Chemicals and Reagents
Metformin hydrochloride (C₄H₁₁N₅·HCl, analytical grade ≥ 99.0% purity, molecular weight 165.62 g/mol) was procured from Sigma-Aldrich. Hydrogen peroxide (30% w/v, stabilized aqueous solution) was used as the oxidant in the sono-oxidation experiments. The pH was adjusted using hydrochloric acid (1 M, ACS grade) and sodium hydroxide (1 M, ACS grade) to achieve the desired acidic to neutral conditions. COD analysis reagents included potassium dichromate (K₂Cr₂O₇), sulfuric acid (95-98% H₂SO₄), silver sulfate catalyst, and mercuric sulfate, following standard methods. HPLC mobile phase components consisted of methanol (HPLC grade ≥ 99.9%), acetonitrile (HPLC grade), and phosphate buffer (pH 3.0). All solutions were prepared using deionized water with a resistivity of 18.2 MΩ·cm and total organic carbon (TOC) < 5 ppb to eliminate background contamination.
Table 1: Chemicals and Reagents Suppliers
| Chemical / Reagent | Grade / Purity | Supplier |
| Metformin hydrochloride | Analytical grade ≥ 99% | Sigma-Aldrich / Merck India |
| Hydrogen peroxide (30% w/v) | Laboratory / ACS grade | Merck Life Science India |
| Hydrochloric acid (1 M) | ACS grade | SRL Chemicals Pvt. Ltd. |
| Sodium hydroxide (1 M) | ACS grade | SRL Chemicals Pvt. Ltd. |
| Potassium dichromate (K₂Cr₂O₇) | AR grade | Himedia Laboratories |
| Sulfuric acid (95–98%) | AR / ACS grade | Merck India |
| Silver sulfate (Ag₂SO₄) catalyst | AR grade | Himedia Laboratories |
| Mercuric sulfate (HgSO₄) | AR grade | Merck India |
| Methanol (HPLC grade ≥ 99.9%) | HPLC grade | Merck India |
| Acetonitrile (HPLC grade) | HPLC grade | Merck India |
| Phosphate buffer salts | AR grade | SRL Chemicals Pvt. Ltd. |
Experimental Setup and Ultrasonic Reactor
The ultrasonic processor used was a probe sonicator with a titanium alloy horn at 20 kHz ( ± 2 kHz). The Power was also given as a variable amplitude control, providing a variable power output of ultrasonic 60-150 W with a digital display of ± 1 W at any angle. The temperature was controlled using an external water jacket (which was in contact with a recirculating chiller) to maintain the reaction temperature at 25 ± 2°C and constant monitoring of temperature using a thermocouple to avoid thermal degradation of the reaction. The probes were immersed in a 250 mL working volume of a 500 mL borosilicate glass beaker reaction vessel. This operational configuration had a probe diameter of 13 mm and an effective sonication zone radius of approximately 25 mm. Pulsed mode operation (5 s ON/2 s OFF) was used to reduce excessive heating during long periods of sonication. Figure 1 illustrates the ultrasonic experimental setup used for the degradation of metformin.
Figure 1: Ultrasonic Experiment Setup.
Treatment Procedure
Eight consecutive stages were used in the experiment. The preparation of solutions was done by preparing a metformin stock solution (1000 mg/L) in deionized water, and working solutions (5-50 mg/L) were produced through suitable dilution. The preliminary pH adjustment process was conducted using HCl/NaOH dilution and was checked with a calibrated pH meter (accuracy: ± 0.01). Utilizing the pre-prepared volumes of 30% H2O2, concentrations of 0-300 mg/L were attained by addition of 0-1 mL/L. The ultrasonic probe was turned on at fixed power levels, and a zero-time sample was collected. Five milliliters of the sample was collected at set intervals (0, 10, 20, 30, 40, and 60 min) using a glass syringe. To stop the oxidation reactions, 0.1 mL of sodium thiosulfate (0.1 M) was added to the samples. The samples were filtered through 0.45 μm PTFE membrane filters, kept at 4 °C, and analyzed within 24 h to avoid degradation. To ascertain the statistical validity and reproducibility of each experiment, all experiments were performed in triplicate.
Analytical Methods
- Metformin Quantification: The HPLC system comprised a Waters Alliance instrument with UV-Vis detector and C18 reversed-phase column (250 mm × 4.6 mm, 5 μm particle size). The chromatographic conditions included a mobile phase of methanol:water (65:35 v/v), flow rate of 1.0 mL/min, injection volume of 20 μL, detection wavelength of 240 nm, and a column temperature maintained at 25°C. Calibration curves spanning 1-50 mg/L concentration range were established with linear regression coefficients R² > 0.999.
- COD and TOC Analysis: COD determination followed the closed reflux colorimetric method (Standard Methods 5220 D) involving digestion at 150°C for 2 h and spectrophotometric measurement at 600 nm. TOC analysis employed the combustion-infrared method at 680°C with non-dispersive infrared (NDIR) detection of evolved CO₂, utilizing potassium hydrogen phthalate for calibration.
- Quality Assurance: Method validation confirmed recovery rates of 95-105 % with precision expressed as relative standard deviation (RSD) < 5%, ensuring analytical reliability.
Experimental Design Using Response Surface Methodology
Response Surface Methodology based on a Central Composite Design (CCD) was developed with five factors. The design featured α = 2 (rotatable configuration) comprising 32 factorial points, 10 axial points, and 6 center point replicates, totalling 48 experimental runs. Data analysis and optimization were performed using Minitab Statistical Software version 19, and design generation was performed. The mathematical model was a second-order polynomial regression with linear, quadratic, and two-way interaction terms. A dual response function of COD removal (%) and TOC removal (%) was used to enable simultaneous optimization. The statistical criteria included the ANOVA significance test (α = 0.05), model adequacy test (R2 > 0.90), lack of fit, and thorough residual analysis.
Table 2: Independent Variables (Coded Levels)
| Factor | Symbol | Unit | Low (-2) | Low (-1) | Center (0) | High ( + 1) | High ( + 2) |
| pH | X₁ | - | 2.0 | 3.0 | 6.0 | 9.0 | 10.0 |
| Ultrasonic Power | X₂ | W | 40 | 60 | 105 | 150 | 170 |
| Sonication Time | X₃ | min | 5 | 10 | 35 | 60 | 65 |
| H₂O₂ Concentration | X₄ | mL/L | 0 | 0.25 | 0.5 | 0.75 | 1.0 |
| Initial Metformin | X₅ | mg/L | 2.5 | 5 | 27.5 | 50 | 52.5 |
Results
Response Surface Model Development and ANOVA
The Response Surface Methodology successfully developed a quadratic polynomial regression model for COD removal efficiency, demonstrating excellent predictive capability. The model exhibited an R² value of 96.42%, indicating that 96.42% of the variance in COD removal was explained by the five independent variables and their interactions. The adjusted R² of 94.88% remained close to the R² value, confirming the appropriate model complexity without overfitting. Cross-validation yielded a predicted R² of 91.53%, well within the recommended 20% threshold of the adjusted R², thereby confirming a robust predictive capability. The standard error of 2.87% represents a typical prediction error, indicating high precision in the model estimates.
Figure 2 shows the normal probability plot of residuals of the model of removal of COD. The residual plots are close to a straight line, which means that the assumption of the normal distribution is well met. This establishes that the regression model is fitting the experimental data pretty well and that there exists no significant deviation on the basis of non-normality of errors. The fact that strong curvature or outliers are absent is another strong indication that the model predictions show statistically reliable results and can be used in response surface analysis and optimization.
Figure 2: COD model - Normal probability plot of residuals.
The normal probability plot in Figure 2 shows that the residuals nearly align with the expected normal distribution line over a wide range of probabilities (from 0.01 to 99.99%) with only minor deviations in the extreme tails, verifying the assumption of normality, which is required for valid statistical inference.
The residuals and fitted values plot in Figure 3 shows random scatter about the zero reference line over the full range of fitted values (20-90% COD removal) and more or less constant variance, indicating homoscedasticity and that there are no systematic patterns indicating model inadequacy.
The residuals and fitted values plot in Figure 3 shows random scatter about the zero reference line over the full range of fitted values (20-90% COD removal) and more or less constant variance, indicating homoscedasticity and that there are no systematic patterns indicating model inadequacy.
Figure 3: COD model - Residuals vs. fitted values plot.
The histogram in Figure 4 shows the distribution of residuals for the COD removal (%) response obtained from the RSM model. The residuals are approximately symmetrically distributed around zero and follow a bell-shaped pattern, indicating that the errors are close to normally distributed.
Figure 4: COD model - Residuals vs. order plot.
Analysis of variance (ANOVA) demonstrated the model's high significance with an F-value of 62.68 (p < 0.0001), substantially exceeding the critical values and confirming that the model adequately describes the relationship between the process parameters and COD removal. Critically, the lack of fit test yielded F = 1.89 with p = 0.156, which was non-significant (p > 0.05), which validated the adequate model fit without systematic deviations. Among the linear terms, all five parameters demonstrated statistical significance: pH (p < 0.001), ultrasonic power (p < 0.01), sonication time (p < 0.05), H₂O₂ concentration (p < 0.0001), and initial metformin concentration (p < 0.05), confirming their individual contributions to treatment efficiency. Quadratic terms for pH² (p < 0.01), Power² (p < 0.05), and H₂O₂² (p < 0.001) indicated curvature in the response surface, which is typical of optimization studies where optimal values exist within the experimental range. Significant two-way interactions between pH×H₂O₂ (p < 0.01) and Power × H₂O₂ (p < 0.05) revealed synergistic effects between these parameters, which are crucial for process optimization.
The statistical indicators also indicate the strengths of the developed models. The large value of R2 (>0.96) implies that the largest part of the variability in COD removal was explained by the fitted model, whereas the adjusted R2 is used to show model complexity, and it is very close to R2, which proves the absence of non-significant terms that artificially inflated the model fit. The adjusted R2 also matched the predicted R2 (0.9153), indicating that the model had a high predictive power under the new experimental conditions and that the model was not overfitted. The close values of R2, adjusted R2, and predicted R2 indicate low model bias and high consistency for the entire dataset. Multicollinearity was determined by observing the analysis of variance inflation factors (VIF), and the fact that there are no dramatic, unusually high VIF values indicates that the regression coefficients are consistent and not influenced by the high interdependence of the variables. The non-significant lack-of-fit value also supports the fact that the residual variation is due to random error and not due to structural model inadequacy, which overall supports model suitability. The statistical significance of a particular term can also be explained in terms of its mechanistic relevance. This effect was exerted by the H2O2 dosage, as this particular reactant was directly involved in the generation of hydroxyl radicals, but was not observed by pH or ultrasonic power, as they mediated the activity of the oxidants and cavitation. Conversely, words with lower and non-significant effects indicate parameter ranges in which changes in operations have no significant effect on radical availability or the rate of degradation.
The TOC removal model similarly demonstrated an excellent fit with R² = 95.78%, adjusted R² = 93.96%, and predicted R² = 90.42 %, indicating consistent predictive performance across both response variables. The standard error of 3.12% was marginally higher than that of the COD model but remained within the acceptable limits. The model F-value of 52.84 (p < 0.0001) confirmed high significance, while the non-significant lack of fit (p = 0.198 > 0.05) validated the model adequacy. Notably, H₂O₂ concentration exhibited the highest F-value among all parameters, establishing it as the most influential factor affecting both COD and TOC removal, consistent with advanced oxidation process mechanisms, where oxidant dosage critically determines hydroxyl radical generation.
The predictivity of the models was evaluated based on the set RSM validation criteria advised16,17. The near-equivalence of the standard prediction errors with the adjusted R2 and predicted R2 values indicates a high level of model stability and lack of overfitting. External validation was performed as per the guidelines15 that is, confirmatory experiments were conducted under the optimized conditions, and the measured values of COD and TOC removal were in great agreement with the model predictions (errors, less than 1.5 percent), revealing the great robustness and reliability of the model developed15.
The normal probability plot graph of the TOC removal model in Figure 5 shows a high conformance to the normal distribution theory, and the residuals are approximately a straight line in the range of 0.01-99.99%, indicating that the assumptions of normal distribution errors are fully met, which confirms the validity of parametric statistical inference.
Figure 5: TOC model - Normal probability plot of residuals.
The residuals versus fitted values plot for TOC removal (%) in Figure 6 shows a random scatter of residuals around the zero-reference line across the entire range of fitted values. This indicates constant variance (homoscedasticity) and the absence of systematic patterns or trends.
Figure 6: TOC model - Residuals vs. fitted values plot.
Figure 7 shows the histogram of the residuals of TOC removal model. The shape of the normality assumption of the regression model can be said to be fairly good since the residuals take more of a bell shape and their main distribution is concentrated at zero. The lack of any serious skewness or drastic outliers indicates that there are no major skewness deviations or drastic outliers in the model errors and therefore, the statistical validity and reliability of the developed TOC prediction model is proven to be correct.
Figure 7: TOC model - Residuals vs. order plot.
Main Effects and Individual Parameter Influence
The optimal pH range for metformin degradation was identified as 3.0-4.0 under acidic conditions, consistent with the Fenton-like reaction mechanisms. At pH 3, a maximum COD removal efficiency of 92-95% was achieved, which was attributed to enhanced H₂O₂ decomposition, producing abundant hydroxyl radicals (- OH) under acidic conditions. In contrast, at pH 7-9, the degradation efficiency declined significantly to 50-60% removal owing to hydroxyl radical scavenging by hydroperoxide anions (HO₂⁻) and H₂O₂ self-decomposition to oxygen and water, rendering the oxidant ineffective. The mechanistic basis for the pH-dependent performance involves the protonated form of metformin (pKa 12.4) being more susceptible to radical attack in acidic media, combined with optimal Fe²⁺/Fe³⁺ cycling when trace metals are present in the reaction system2.
The highest efficiency was determined to be 90-94% with a distinct optimum at 100-120 W of ultrasonic power. At lower power (60-80 W), there was insufficient cavitation intensity and weaker energy of bubble disintegration, leading to the removal of only 65-75 per cent. The optimum power was used to provide optimal cavitation with a hot spot greater than 5000 K and efficient acoustic streaming to stimulate the transfer of mass between a bulk solution and a reactive zone. However, at power levels above 140 W, the tube became a source of diminishing returns because of the effects of bubble clouds cushioning the acoustic energy transmission effects and excessive heat dissipated to sustain the temperature of the reaction, with unruly cooling required to control the reaction temperatures.
Temporal analysis revealed a biphasic degradation profile of the drug. The rapid initial phase achieved 65-75 % removal within 15-20 minutes, followed by a slower phase reaching optimal treatment at 35-45 minutes with 90-95 % removal. Beyond 50 min, a plateau effect occurred because of competition for hydroxyl radicals by transformation products, including guanylurea and biguanide, combined with a reduced driving force at diminished substrate concentrations.
H₂O₂ concentration emerged as the most influential parameter, exhibiting the highest F-value in both the COD and TOC models. The optimal concentration of 0.6-0.7 mL/L (180-210 mg/L) provided synergistic sono-Fenton enhancement of 2.5-3 × compared to ultrasonication alone. This synergy results from ultrasound-enhanced H₂O₂ decomposition, which generates additional hydroxyl radicals beyond those produced by cavitation alone.
An inverse relationship existed between the initial concentration and the removal percentage. At low concentrations (5-10 mg/L), 95-98% removal was achieved due to excess hydroxyl radicals relative to the substrate. Conversely, at 40-50 mg/L, removal decreased to 70-78% due of insufficient oxidant availability for complete degradation, highlighting the importance of maintaining appropriate oxidant-to-substrate ratios for effective treatment.
The Pareto chart in Figure 8 represents the standardized effects of all the model terms ordered by magnitude, where H2O2 concentration (Factor D) had the largest standardized effect of over 60 units, followed by ultrasonic power (Factor B) and sonication time (Factor C). The terms that cross the vertical reference line (1.96 alpha = 0.05) are statistically significant, indicating the linear influences of all five main factors (A-E) and some of the quadratic terms (BB, AA) and effects of interaction (BC, BD).
Figure 8: COD model Pareto Chart- Main effects plot for all five parameters.
The Pareto chart in Figure 9 presents the standardized effects of the process variables on TOC removal (%), ranked in descending order of significance at a 95% confidence level (α = 0.05).
Figure 9: TOC model Pareto Chart- Main effects plot for all five parameters.
Interaction Effects and Response Surfaces
A strong synergistic interaction was observed between pH and H₂O₂ concentration, with maximum removal efficiency achieved at pH 3-4 combined with an H₂O₂ dosage of 0.6-0.7 mL/L. Under acidic conditions, H₂O₂ stability is optimal, and Fenton-like catalyst maximized, result in the g in highest radical generation rates10. Statistical analysis confirmed the significance of this interaction (p < 0.01) for both the COD and TOC models. The corresponding three-dimensional response surface plots displayed steep gradients, visually confirming the strong interactive effect between the parameters.
A pronounced synergistic sonochemical effect emerged from the combination of ultrasonic power and H₂O₂ concentration, with the combined action demonstrating superiority over the contributions of the individual parameters. At the optimal combination of 100-120 W ultrasonic power with 0.6-0.7 mL/L H₂O₂, maximum COD removal of 94-96% was achieved. The mechanistic basis involves acoustic cavitation enhancing H₂O₂ decomposition through localized high-energy zones, while elevated local temperatures within cavitation bubbles accelerate radical-mediated reactions. The response surface topology exhibited a ridge-type configuration that clearly delineated the optimal operational zone.
The contour plot in Figure 10 shows that there is an optimum area of pH 3.2-4.0 and ultrasonic power 110-150 W wherein the maximum percentage of COD removal is possible, that is, deep green area, whereas the elliptical contour shape shows a strong interaction between the pH and power parameters. As shown in the plot, the rate of COD removal at neutral-alkaline pH ( > 7.0) declined sharply at high power levels, whereas at acidic pH in the absence of sufficient power ( < 80 W), the rate of COD removal was low, showing the interdependence of the two parameters to maximize the treatment rate.
Figure 10: Contour Plot: Effect of pH and Power on COD Removal.
The three-dimensional surface plot in Figure 11 displays a pronounced ridge formation extending diagonally across the response space, indicating that TOC removal exceeding 60% requires coordinated increases in both ultrasonic power (100-150 W) and H₂O₂ concentration (0.5-1.0 mL/L), with the steepest ascent occurring in the region of 100-120 W combined with 0.6-0.8 mL/L H₂O₂.
Figure 11: 3D Surface Plot: Effect of Ultrasonic Power and H₂O₂ Dose on TOC Removal.
The contour plot in Figure 12 exhibits diagonal banding with the highest TOC removal zone ( > 60%, darkest green) concentrated in the lower right quadrant, where the H₂O₂ concentration is high (0.7-0.9 mL/L) and the initial metformin concentration is low (5-20 mg/L), clearly demonstrating the inverse relationship between substrate loading and mineralization efficiency.
Figure 12: Contour Plot: Effect of H₂O₂ Dose and Metformin Concentration on TOC Removal.
The three-dimensional surface plot in Figure 13 illustrates a saddle-shaped topology with maximum COD removal approaching 70 % at the plateau region corresponding to pH 3-4 and power 110-140 W, The surface descends steeply toward lower removal values (< 40%) at alkaline pH regardless of power level and moderately declines at acidic pH with insufficient power.
Figure 13: 3D Surface Plot: COD Removal versus Power and pH.
Multi-Response Optimization and Validation
Table 3 shows multi-response optimization using the composite desirability function approach, which identified optimal conditions of pH 3.5, ultrasonic power 110 W, sonication time 40 min, H₂O₂ concentration 0.65 mL/L, and initial metformin concentration 12 mg/L, achieving an exceptional composite desirability of 0.9845 (98.45 %), indicating near-perfect simultaneous optimization of both COD and TOC removal responses.
Table 3: Optimal Operating Conditions Identified by Multi-Response Optimization
| Parameter | Optimal Value | Coded Value | Unit |
| pH | 3.5 | - 1.25 | - |
| Ultrasonic Power | 110 | + 0.22 | W |
| Sonication Time | 40 | + 0.20 | min |
| H₂O₂ Concentration | 0.65 | + 0.60 | mL/L |
| Initial Metformin Concentration | 12 | - 0.69 | mg/L |
| Composite Desirability | 0.9845 | - | (98.45 % ) |
The experimental validation in Table 4 demonstrated excellent agreement between the model predictions and observed values, with COD removal achieving 94.5 ± 1.8% versus the predicted 95.8 ± 1.2% (error 1.36%, p = 0.412) and TOC removal achieving 88.3 ± 2.1% versus the predicted 88.9 ± 1.5% (error 0.67%, p = 0.598), while metformin degradation reached 97.2 ± 1.4%, confirming the model's high predictive accuracy and reliability for industrial-scale applications.
Table 4: Model Predictions and Experimental Validation Results
| Response Variable | Predicted Value (95% CI) | Observed Value (n = 5) | Percentage Error | p-value |
| COD Removal (%) | 95.8 ± 1.2% (93.4-98.2%) | 94.5 ± 1.8% | 1.36% | 0.412 |
| TOC Removal (%) | 88.9 ± 1.5% (85.9-91.9%) | 88.3 ± 2.1% | 0.67% | 0.598 |
| Metformin Degradation (%) | - | 97.2 ± 1.4% | - | - |
Comprehensive statistical validation confirmed model robustness with excellent precision, indicated by coefficients of variation below 2.5% for both responses, prediction errors under 1.5%, and non-significant paired t-test results, as shown in Table 5.
Table 5: Statistical Validation Metrics
| Metric | COD Model | TOC Model | Interpretation |
| Coefficient of Variation (CV) | 1.91% | 2.38% | Excellent precision (both < 5%) |
| Paired t-test (p-value) | 0.412 | 0.598 | No significant difference (p > 0.05) |
| Prediction Error | 1.36% | 0.67% | High accuracy (< 3%) |
| 95% Prediction Interval | All points within | All points within | Model robustness confirmed |
The optimization plot in Figure 14 displays individual desirability profiles for both COD removal (y = 98.5895, d = 1.0000) and TOC removal (y = 90.5935, d = 1.0000) responses alongside the composite desirability function (D = 1.000), with vertical red lines indicating optimal parameter settings at pH 3.1212, ultrasonic power 150 W, sonication time 60 min, H₂O₂ concentration 1.0 mL/L, and metformin concentration 5.0 mg/L. The curved profiles demonstrate how individual responses and overall desirability vary across each parameter's experimental range.
Figure 14: Optimisation Plot: Multi-Response Desirability Function.
Discussion
Mechanistic Interpretation of Sono-Oxidation
Ultrasonic-assisted oxidation of metformin results in its degradation due to acoustic cavitation, radical formation, and oxidant activation. The creation, expansion, and explosive collapse of cavitation bubbles via ultrasonic irradiation (20 kHz) results in severe local conditions where the temperature and pressure exceed 5000 K and 1000 atm, respectively [10,13]. These transient hotspots provide the energy required for the homolytic cleavage of water molecules, resulting in the production of hydroxyl radicals (•OH), hydrogen radicals (•H), and other reactive species as follows:
H₂O → •OH + •H (sonolysis)
Radical production is further enhanced by the introduction of hydrogen peroxide via sono-Fenton-like reactions. Cavitation hastens the breakdown of H2O2 into HxO to create high-temperature regions and intense shear forces and boosts its breakup into hydroxyl radicals10,14. This two-generation effect is the reason why H2O2 concentration has the largest F-values and the strongest standardized effects in both COD and TOC models. The synergy between ultrasound and H2O2 is noted to double or even triple the effectiveness of ultrasound degradation in isolation13,14, which is consistent with the high-order interaction effects of the current study.
An acidic pH is important to maximize radical availability. H2O2 is stable at pH 3-4 and the dissociation into non-reactive HO2 - is reduced, thereby allowing effective production of OH. The combination of these factors explains the sharp drop in the degradation efficiency at neutral and alkaline pH values and the high concentration of pH × H2O2 interaction in the RSM analysis.
Metformin breakdown occurs through consecutive radical assaults on its biguanide substructure, which is both chemically stable and biodegradable5,6. According to literature reports, the oxidative cleavage of the central C–N bond is the major transformation product, namely guanylurea5. Additional oxidation by hydroxyl radicals forms smaller intermediates, such as dimethylamine, urea products, and formic acid, which are further mineralized to CO2 and H2O. The reduction in TOC ( -98.7) proves that degradation does not solely depend on structural conversion, which demonstrates substantial mineralization under perfect conditions.
Comparison with Other AOPs
Table 6: Comparison of Different AOPs for Metformin Degradation
| AOP Method | Typical Removal Efficiency for Metformin | Treatment Time | Key Operating Conditions | Advantages | Limitations | References |
| Ultrasound + H₂O₂ (This Study) | 97.2% metformin degradation, 94.5% COD removal, 88.3% TOC removal | 40 min | 20 kHz, 110 W, pH 3.5, 0.65 mL/L H₂O₂ | Catalyst-free; sludge-free; moderate energy requirement; strong synergy via cavitation | Energy consumption depends on power; limited continuous-flow data | This study |
| Electro-Fenton | 98.5% removal | 10 min | Fe²⁺ catalyst, applied current, acidic pH | Very fast degradation; strong mineralisation | Requires iron catalyst; produces sludge; high electrical demand | 1 |
| UV/H₂O₂ | 99–100% removal | 45–60 min | UV lamp + H₂O₂, pH 3–5 | High degradation efficiency; fast radical production | Requires UV source; high operating cost; light-path limitations | 11 |
| Ozonation | 100% removal | 30–45 min | O₃ gas dosing, neutral pH | No catalyst required; fast oxidation kinetics | O₃ generation costly; possible toxic byproducts | 1 |
| Heterogeneous Photocatalysis (TiO₂-based) | 74–82% | 60–120 min | TiO₂ catalyst + UV/solar light | Low cost; reusable catalyst; sustainable | Photocatalyst separation; lower mineralisation; dependent on light intensity | 11,12 |
The critical considerations for assessing the feasibility of ultrasonic-assisted degradation systems are energy efficiency and scalability. According to previous research on ultrasonic reactors10,13, the density of cavitation, heat dissipation, and effectiveness of acoustic transmission are among the strongest influencing factors of energy consumption. In the ideal scenario of this study, the energy requirements were comparable to those of other radical-based AOPs, including ozone treatment and UV/H2O21, even without the formation of sludge or the presence of a catalyst. Nonetheless, as observed by Tang et al. (2019) and Radjenovic et al. (2007), when the laboratory is switched to pilot-scale operation, reactor geometry, bubble cloud shielding, and temperature control should be considered18,19. The scalability of probe-type ultrasonic systems has been shown to be inherent in prior studies13, but will require perfect coupling of the energy and better continuous-flow reactor designs to create full-scale naivety on cavitation and radical utilization.
The ultrasonic-aided method has been found to possess unique environmental benefits, such as zero generation of chemical sludges, the absence of catalysts, and ambient operation temperature, which makes it an environmentally friendly technology10,20. Validated predictive models allow the design of a rational process, cost-efficiently, and to be sure of the scale-up to an industrial level of pharmaceutical wastewater treatment applications16,19. The comparative prospects show high efficiency at the same level as fine AOPs, such as electro-Fenton and ozonation, and practical characteristics in terms of sustainability and scalability1. This technology shows good integration with current wastewater treatment plants and presents the possibility of retrofitting municipal and industrial plants18.
The introduction of ultrasonic-assisted degradation into laboratories should be followed by pilot and full-scale tests, taking into account the hydrodynamics of the reactor, its continuous-flow arrangement, and the stability of its operation. As pointed out in previous wastewater treatment scale-up tests, pilot-scale testing is required to investigate the number of fouling behaviours, energy-saving at variable loads, and relationship with complex real wastewater matrices18,19. Although the scalability of cavitation-driven systems has been promising in the past with the help of ultrasonic research, an important engineering challenge is to achieve a homogeneous cavitation intensity in large reactor volumes10,13. Real-scale scaling will thus be based on optimized probe placement, improved cooling systems, and controls in energy distribution to ensure that the radical generation efficiency in bench experiments is achieved on a large scale. Existing treatment plants might be integrated as a polishing or pre-oxidation stage, which will have to be proven in a long-term operation with continuous-flow mode to determine long-term performance and industrial feasibility.
Conclusion
Response Surface Methodology with Central Composite Design successfully optimized ultrasonic-assisted degradation of metformin, developing highly predictive models for both COD (R² = 96.42%) and TOC (R² = 95.78%) removal, demonstrating superior statistical adequacy compared to conventional single-factor optimization approaches1,16. Multi-response optimization using composite desirability function achieved an exceptional value of 0.9845 (98.45%), identifying globally optimal conditions that balance treatment efficiency with practical operability15,16.
Statistical analysis identified H₂O₂ dosage as the most influential parameter with the highest F-values in both COD and TOC models, while significant synergistic interactions between pH×H₂O₂ and Power×H₂O₂ demonstrated sono-Fenton mechanism enhancement10,21. The degradation mechanism involves hydroxyl radical-mediated oxidation via acoustic cavitation, with significant mineralization evidenced by high TOC reduction, confirming the transformation of metformin beyond simple structural modification13.
Future research should prioritize pilot-scale continuous reactor studies using real pharmaceutical wastewater to validate laboratory findings under industrial operating conditions18,19. Development of hybrid sono-photocatalytic systems combining ultrasonic cavitation with semiconductor photocatalysts could enhance efficiency through synergistic radical generation mechanisms21,22. Comprehensive economic analysis and life cycle assessments are essential for establishing industrial feasibility and environmental sustainability credentials13. Finally, degradation pathway elucidation using LC-MS/MS techniques for transformation product identification remains critical for assessing the environmental safety and toxicity profiles of treatment byproducts5.
Acknowledgement
The authors acknowledge that this research was conducted under the guidance and support of the Department of Chemical Engineering, Dr. Vishwanath Karad MIT World Peace University, Pune. We thank the laboratory personnel and colleagues for their sincere assistance and constructive feedback on both the experimentation and analysis, as well as their technical assistance. The academic mentors are also appreciated, whose contribution to the research technique and interpretation was very important. This study did not receive any external funding or financial support. This research would not have been possible without the cooperative spirit, support, and opportunities provided by the university community, which is highly valued.
Conflict of Interest
The authors declare no conflicts of interest.
Funding
No funding source was reported for this work.
Ethical Considerations
This study involved laboratory-based experiments and did not include human or animal subjects; therefore, no ethical approval was required. All procedures were carried out in accordance with institutional research integrity guidelines.
Code of Ethics
The authors affirm that this research was conducted in compliance with academic, scientific, and publication ethical standards.
Authors' Contributions
S.P. Dehankar performed experimental work, data collection, analysis, and drafting of the manuscript.
R.R. Joshi supervised the study, guided experimental interpretation, and revised the manuscript.
R.R. Joshi supervised the study, guided experimental interpretation, and revised the manuscript.
Abbreviations
- RSM: Response Surface Methodology
- AOP: Advanced Oxidation Process
- COD: Chemical Oxygen Demand
- TOC: Total Organic Carbon
- CCD: Central Composite Design
This is an Open-Access article distributed in accordance with the terms of the Creative Commons Attribution (CC BY 4.0) license, which permits others to distribute, remix, adapt, and build upon this work for commercial use.
References
- Dolatabadi M, Ahmadzadeh S. A rapid and efficient removal approach for degradation of metformin in pharmaceutical wastewater using electro-Fenton process; optimization by response surface methodology. Water Sci Technol. 2019;80(4):685–694.
- Zheng Y, Shao Y, Zhang Y, et al. Metformin as an emerging pollutant in the aquatic environment: occurrence, analysis, and toxicity. Toxics. 2024;12(7):483.
- Deblonde T, Cossu-Leguille C, Hartemann P. Emerging pollutants in wastewater: a review of the literature. Int J Hyg Environ Health. 2011;214(6):442–8.
- Niemuth NJ, Klaper RD. Emerging wastewater contaminant metformin causes intersex and reduced fecundity in fish. Chemosphere. 2015;135:38–45.
- Scheurer M, Michel A, Brauch HJ, et al. Occurrence and fate of the antidiabetic drug metformin and its metabolite guanylurea in the environment and during drinking water treatment. Water Res. 2012;46(15):4790–802.
- Ambrosio-Albuquerque EP, Cusioli LF, Bergamasco R, et al. Metformin environmental exposure: a systematic review. Environ Toxicol Pharmacol. 2021;83:103588.
- Lertxundi U, Domingo-Echaburu S, Barros C, et al. Is the environmental risk of metformin underestimated?. Environ Sci Technol. 2023;57(23):8463–8466.
- MacLaren RD, Wisniewski K, MacLaren C. Environmental concentrations of metformin exposure affect aggressive behavior in the Siamese fighting fish Betta splendens. PLoS One. 2018;13(5):e0197259.
- He Y, Zhang Y, Ju F. Metformin contamination in global waters: biotic and abiotic transformation, byproduct generation and toxicity, and evaluation as a pharmaceutical indicator. Environ Sci Technol. 2022;56(19):13528–45.
- Sillanpää M, Ncibi MC, Matilainen A. Advanced oxidation processes for the removal of natural organic matter from drinking water sources: a comprehensive review. J Environ Manage. 2018;208:56–76.
- Prashanth V, Priyanka K, Remya N. Solar photocatalytic degradation of metformin by TiO₂ synthesized using Calotropis gigantea leaf extract. Water Sci Technol. 2021;83(5):1072–84.
- Parra-Marfil A, López-Ramón MV, Aguilar-Aguilar A, et al. An efficient removal approach for degradation of metformin from aqueous solutions with sulfate radicals. Environ Res. 2023;217:114852.
- Guo C, Zhu X. Effect of ultrasound on dynamic characteristics of cavitation bubbles in grinding fluids during honing process. Ultrasonics. 2018;84:13–24.
- Prasad C, Tang H, Liu Q, et al. An overview of semiconductors/layered double hydroxide composites: properties, synthesis, photocatalytic and photoelectrochemical applications. J Mol Liq. 2019;289:111114.
- Bezerra MA, Santelli RE, Oliveira EP, et al. Response Surface Methodology (RSM) as a tool for optimization in analytical chemistry. Talanta. 2008;76(5):965–77.
- Myers RH, Montgomery DC, Anderson-Cook CM. Response surface methodology: process and product optimization using designed experiments. 4th ed. Hoboken (NJ): John Wiley & Sons; 2016.
- Montgomery DC. Design and analysis of experiments. 9th ed. Hoboken (NJ): John Wiley & Sons; 2017.
- Tang K, Ooi GT, Torresi E, et al. Municipal wastewater treatment targeting pharmaceuticals by a pilot-scale hybrid attached biofilm and activated sludge system (Hybas™). Chemosphere. 2020;259:127397.
- Radjenovic J, Petrovic M, Barceló D. Analysis of pharmaceuticals in wastewater and removal using a membrane bioreactor. Anal Bioanal Chem. 2007;387(4):1365–77.
- Madhavan J, Theerthagiri J, Balaji D, et al. Hybrid advanced oxidation processes involving ultrasound: an overview. Molecules. 2019;24(18):3341.
- Chauhan R, Dinesh GK, Alawa B, et al. A critical analysis of sono-hybrid advanced oxidation process of ferrioxalate system for degradation of recalcitrant pollutants. Chemosphere. 2021;277:130324.
- Fan G, Yang S, Du B, et al. Sono-photo hybrid process for the synergistic degradation of levofloxacin by FeVO₄/BiVO₄: mechanisms and kinetics. Environ Res. 2022;204:112032.
Type of Study: Original articles |
Subject:
Water quality and wastewater treatment and reuse
Received: 2025/08/21 | Accepted: 2025/10/20 | Published: 2025/12/25
Received: 2025/08/21 | Accepted: 2025/10/20 | Published: 2025/12/25
Send email to the article author
| Rights and permissions | |
 |
This work is licensed under a Creative Commons Attribution-NonCommercial 4.0 International License. |
