

Volume 3, Issue 1 (March 2018)
J Environ Health Sustain Dev 2018, 3(1): 454-463 |
Back to browse issues page


Download citation:
BibTeX | RIS | EndNote | Medlars | ProCite | Reference Manager | RefWorks
Send citation to:


BibTeX | RIS | EndNote | Medlars | ProCite | Reference Manager | RefWorks
Send citation to:
Arsham A, Sadeghi M, Sadeghi M. Evaluation of the Physicochemical Properties of Water in AqQala City (Golestan Province), 2005-2015. J Environ Health Sustain Dev 2018; 3 (1) :454-463
URL: http://jehsd.ssu.ac.ir/article-1-100-en.html
URL: http://jehsd.ssu.ac.ir/article-1-100-en.html


Environmental Health Research Center, Department of Environmental Health Engineering, School of Health, Golestan University of Medical Sciences, Gorgan, Iran.
Full-Text [PDF 741 kb]
(997 Downloads)
| Abstract (HTML) (3644 Views)
Citation: Arsham A, Sadeghi A, Sadeghi M. Evaluation of the Physicochemical Properties of Water in AqQala City (Golestan Province), 2005-2015. J Environ Health Sustain Dev. 2018; 3(1): 454-63.
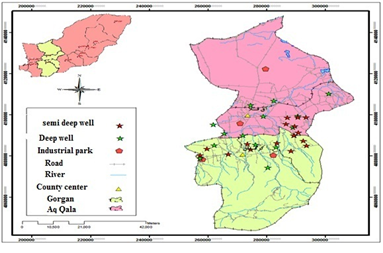
Figure 1: Rural water source in AqQala
Table 1: Rural water supply facilities in AqQala (All of sources are deep wells)
.png)
Figure 2: Amount of turbidity in the drinking water sources of AqQala villages
.png)
Figure 3: Concentration of ammonium in the drinking water sources of AqQala villages
.png)
Figure 4: Concentration of phosphate in the drinking water sources of AqQala villages
.png)
Figure 5: Concentration of fluoride in the drinking water sources of AqQala villages
.png)
Figure 6: Concentration of total hardness in drinking water sources of AqQala villages
.png)
Figure 7: Concentration of sulfate in the drinking water sources of AqQala villages
.png)
Figure 8: Concentration of nitrate in drinking water sources of AqQala villages
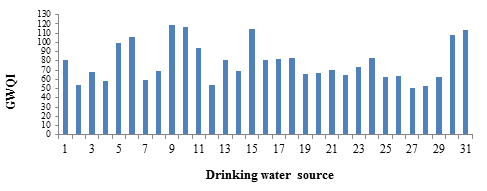
Figure 9: The GWQI Index for drinking water resources in the village of AqQala in 2015
Table 4: The GWQI Index for drinking water resources in the villages of AqQala in 2015
Discussion
The mean of turbidity in water resources shows that turbidity has increased in some years (Figure 2). The aquifers of AqQala groundwater are mostly fine-grained and have sandstone, and in this area, most of the reservoir has been built for relaxation to solve this problem for all sources of inverter installed, and by installing the inverter device, the sand was reduced, but completely not resolved. The excessive turbidity prevents proper water disinfection and protects microorganisms 20. The rate of ammonium in all of sources is higher than the standard range (1.5 mg/L). From 2008 onwards the amount of ammonium has been increased (figure 3). The high ammonium concentration in all water sources is the probability of entering and infiltration of wastewater from the absorbent wells due to the slope of the area towards AqQala. The study by Doussan et al. shows that high NH4 concentration is related to the heavy organic load in the river and the mineralization of this organic matter by benthic microflora. Among different mechanisms that influence NH4 transport and retention in the porous medium, it emerges the sorption by alluvial sediments 21.The rate of phosphate in all of sources is higher than the standard range (0.2 mg/L). From 2008 onwards the amount of phosphate has been increased (Figure 4).The reason for decreasing the amount of phosphate in some years is the presence of drought. By the way, agricultural activities and sewage leakage from the wells lead to high level of nutrition 22.The rate of fluoride in all of sources is lower than the standard range (1.4-2.4 mg/L).The main source of fluoride in groundwater is rocks which are rich in fluoride. Fluoride occurs in sellaite, fluorite, cryolite, fluorapatite, apatite, fluormica, biotite, amphibole and several other rocks. Low calcium, high sodium and high bicarbonate are typical of high fluoride groundwater. The other sources for fluoride are infiltration of agricultural runoff containing chemical fertilizers, improper disposal of liquid waste from industries, alumina smelting, cement production and ceramic and brick firing. Some amount of fluoride is essential for the human body for healthy teeth and bones 23. Due to the low level of fluoride in all drinking water sources in AqQala villages, fluoridation is recommended to prevent the effects of fluoride deficiency on the human health. The results of this study showed that the concentration of nitrate in the water of AqQala is lower than the standard (Figure8), but the amount of sulfate and hardness is high; since, nitrate can mobilize sulfate from geological pyrite deposits by oxidation of FeSx in the aquifer, leading to a decrease of nitrate and an increase of groundwater sulphate concentrations 22. Some parameters such as sulfate and phosphate have decreased from 2008 to 2013 that is the reason for decreasing the concentration of this parameter in the presence of drought. Although these parameters are reducing, their values in some sources are higher than the standard. The results measured by the GWQI index in groundwater resources showed that the groundwater source was not with excellent water quality. About 19.3% of sources had poor qualities and the other ones had good qualities. As well as some sources (such as 5, 11) had near poor qualities. The results of water quality over the eleven-year period have shown that water quality is reduction. Therefore, comprehensive management of drinking water resources is essential for people's health.
Full-Text: (1150 Views)
Evaluation of the Physicochemical Properties of Water in AqQala City (Golestan Province), 2005-2015
Amir Arsham 1, Mahdi Sadeghi 2, 3*, Masoumeh Sadeghi 4
1 Water and Wastewater Civil Engineering, Lamei Gorgani Institute of Higher Education, Lamei Gorgani University, Gorgan, Iran.
2 Cereal Health Research Center, School of Health, Golestan University of Medical Sciences, Gorgan, Iran.
Amir Arsham 1, Mahdi Sadeghi 2, 3*, Masoumeh Sadeghi 4
1 Water and Wastewater Civil Engineering, Lamei Gorgani Institute of Higher Education, Lamei Gorgani University, Gorgan, Iran.
2 Cereal Health Research Center, School of Health, Golestan University of Medical Sciences, Gorgan, Iran.
3Environmental Health Research Center, Department of Environmental Health Engineering, School of Health, Golestan University of Medical Sciences, Gorgan, Iran.
4Environmental Health Engineering, Gorgan, Iran.
| A R T I C L E I N F O | ABSTRACT | |
| ORIGINAL ARTICLE | Introduction: The groundwater is the main resource of water. This study aimed to investigate water quality variations in the villages of AqQala in a eleven-year period as well as designing and implementing the Water Quality Index (WQI). Materials and Methods: In order to investigate water quality variations, the data in the villages of AqQala city was collected in an eleven-year period (2005-2015). Also, according to the research objectives, a sample period in year 2015 was carried out. Samples were measured according to the standard method for examination of water and wastewater. In order to calculate the Groundwater Water Quality Index (GWQI), the Iranian Water Quality Index Software (IWQIS) was used. Results: Some parameters of water quality, including pH, calcium, magnesium and potassium in all sources, were in standard limit. Some of the parameters were higher than the standard limit, which included turbidity, ammonium, phosphate in all sources and sulfate, chloride, sodium, iron and manganese, silicate and alkalinity in some resource. The results measured by the GWQI index in groundwater resources showed that the groundwater source was not with excellent water quality. About 19.3% of sources had poor qualities and the other sources had good qualities. Conclusion: The results of water quality over this period showed that some parameters were increased; which leads to water quality reduction. Therefore, comprehensive management of drinking water resources is essential for people's health. |
|
| Article History: Received: 25 October 2017 Accepted: 20 January 2018 |
||
| *Corresponding Author: Mahdi Sadeghi Email: dr-sadeghi@goums.ac.ir Tel: +981732436102 |
||
| Keywords: Drinking Water, Groundwater, Water Quality. |
Citation: Arsham A, Sadeghi A, Sadeghi M. Evaluation of the Physicochemical Properties of Water in AqQala City (Golestan Province), 2005-2015. J Environ Health Sustain Dev. 2018; 3(1): 454-63.
Introduction
Access to safe drinking water sources in many countries of the world, especially in rural areas, is an important subject 1. The groundwater is the main resource of water, which is commonly used for drinking in domestic, irrigation and industrial purposes. The quality of groundwater is importance for domestic and agricultural activities in towns and villages and small communication 2- 6. The quality of groundwater depends on the geologic of an area and mostly contains more mineral contents thanthe surface water 7. Furthermore, the hydrologic conditions have a significant role in the groundwater quality change 7.
Rapid growth of population and industrial activity, unplanned urbanization, improper management of water body, climatic variability and anthropogenic activities, incomplete treatment of wastewater, improper disposal of municipal and industrial waste are among major factors that affect the quality of drinking water 2- 3, 8. Several study regarding the groundwater quality done by many authors such as Pandey et al. 8, Bisht Pandian et al. 9 10, Rajan and Paneerselvam. 11, Thakare et al. 12 and Abinandan et al 2.They concluded that inappropriate dumping of solid waste and uncontrolled landfill as well as wastewater and liquid waste, lack of strict enforcement of law and loose governance are causes of deterioration of ground water quality 2, 8- 12.Therefore, it is necessary to have a plan for monitoring and managing groundwater and preventing changes in their quality. Various researchers have tried to develop a wide range of WQI for evaluation of groundwater quality; the choice of index depends on the groundwater input parameters and the desired results 3, 13- 17.
The WQI is introduced as a mathematical instrument to convert the water quality dataset into a single number which represents the water quality level for various applications 13. The application of water quality indices allows the evaluation and assessment of changes in water quality over time and space and also the evaluation of the efficacy of domestic policies and international strategies designed to protect aquatic resources 13. Water quality indices are also used for the classification of water 3.Surface water quality indices are different from groundwater quality ones. The most important water quality index is the National Sanitation Foundation Water Quality Index (NSFWQI) number is between 0 and 100, and the closer the index is to 100, the better the quality of water 18. However, in groundwater, conditions are different from surface waters. Different qualitative indices are presented depending on geographicallocation by different studies 13- 14. For example Ramakrishnaiah et al. presented a groundwater WQI which was based on 12 parameters , including pH, Total Hardness (TH), Ca+2, Mg+2, HCO3−, Cl−, NO3−, SO4−2, Total Dissolved solids (TDS), Fe+2, Mn+2, and F−.According to their presented method, values of these 12 parameters should be monitored to calculate the WQI 14. In Iran, Nibizadeh et al. designed the IWQIS for groundwater resources which is in accordance with the standard 1053 of the National Iranian Standards Organization. The numerical value of the index is between 0 and more than 300, the larger the index number indicates the unfavorable quality of the water 9. AqQala is one of the cities in Golestan Province. The Golestan providence rural water and wastewater company in the villages of AqQala has served 81 villages. Most of the drinking water sources in AqQala villages are provided from deep wells and the aquifers are not qualitatively and quantitatively normal and standardized, so that most water resources are supplied from the southern parts of the city. Furthermore, aquifers are mainly fine grained sandstone and thus in most of the area, a reservoir of tranquility and reserve has been built. Considering the south-north slope and the location of AqQala in the north of Gorgan city as well as the probability of contamination in AqQla waters to wastewater discharged into wells, this study aimed to investigate the water quality variations in the villages of AqQala in an eleven-Year old period and calculation of the WQI.
Materials and Methods
The studied population is the drinking water resources of the villages covered by AqQala rural water and Wastewater Company, which consists of 31 rural water supply facilities. The rural water supply facilities in AqQala are are show in Table 1 and Figure 1.
Figure 1: Rural water source in AqQala
Table 1: Rural water supply facilities in AqQala (All of sources are deep wells)
| Rural water supply facilities | No | Rural water supply facilities | No |
| Bahleke sheikh musa (Alghadir4) | 17 | Mirzaali | 1 |
| Bahleke sheikh musa (Alghadir5) | 18 | Ghangherme | 2 |
| Kiveli | 19 | Chen soveili | 3 |
| Gery | 20 | Aqzobeir | 4 |
| Bagheseikhmusa | 21 | Aqghabr | 5 |
| Bahlekedashli | 22 | Tazeabad | 6 |
| Jamaran | 23 | Yolmekhandan | 7 |
| Pirvash (well 1) | 24 | Yampi | 8 |
| Kord | 25 | Sahne | 9 |
| Delijeh | 26 | Sahne | 10 |
| Pirvash (well 2) | 27 | Aqdagesh | 11 |
| Pirvash (well 3) | 28 | Heidarabad | 12 |
| Ghorbanabad | 29 | Ghalehjigh | 13 |
| Yolmesalian | 30 | Aq take khan | 14 |
| Och tape | 31 | Bahleke sheikh musa (Alghadir1) | 15 |
| Bahleke sheikh musa (Alghadir3) | 16 |
Data collection and analysis
In order to investigate the process of changes in water quality, data in the villages of AqQala city during the eleven-year period was taken (2005-2015) from rural water and wastewater company. Also, according to the research objectives, a sample period in year 2015 was carried out in two parts of the low rainy seasons (the first six months) and rainy seasons (the second six months). Parameters were measured according to the standard method for examination of water and wastewater in the laboratory of rural water and wastewater company 19. The temperature, pH and Electrical Conductivity (EC) and TDS were measured by Lovibond multiparameter device. Turbidity by 2100P Hach device, and Hardness, alkalinity, chloride were measured by titration. Furthermore sulfate, nitrate, phosphate, ammonium, iron, manganese and fluoride were measured by UV-visible spectrophotometry methods, and Sodium by flame photometer 19.
Calculation of groundwater quality index (GWQI)
To calculate GWQI, IWQIS Software designed by Nabizadeh et al. was used 13.The software and excel data sheet can be downloaded from:
http://tums.ac.ir/ajaxplorer/data/public/2941eae50882f1adcb47436ef78c0e16.php?lang=en).
Table 2 shows the criteria parameters, weight factors, and limit values considered for setting up the water quality index. Table 3 reveals the water quality classification based on the IWQIS values.
Table 2: Criteria parameters, weight factors, and limit values considered for setting up IWQIS 13
| Criteria parameters | Value | Limit values |
| pH* | 4 | 6.5–8.5 |
| Calcium | 2 | 300 |
| Magnesium | 2 | 30 |
| Chloride | 3 | 250 |
| TDS | 4 | 1000 |
| Fluoride | 4 | 1.5 |
| Manganese | 4 | 0.1 |
| Nitrate | 5 | 50 |
| Iron | 4 | 0.3 |
| Sulfate | 4 | 250 |
| Ammonium | 3 | 1.5 |
| Sodium | 3 | 200 |
| Turbidity | 4 | 5 |
* Except pH and turbidity (NTU), other parameters according to mg/L
Table 3: Water quality classification based on IWQIS values 13
Table 3: Water quality classification based on IWQIS values 13
| Water quality index values | Interpretation |
| < 50 | Excellent water quality |
| 50–100 | Good water quality |
| 100–200 | Poor water quality |
| 200–300 | Very poor water quality |
| > 300 | Unsuitable for drinking |
Results
The area of AqQala has 31 rural water supply facilities and 61 water wells with a flow rate of 520 L/s. All sources of drinking water in villages are deep wells that are located in the southern part of the city. In this study, the quality of water in the villages of AqQala was evaluated in an eleven-year period (2005-2015) and in 2015 the sampling was carried out twice, consequently in 2015, the GWQI index was calculated with IWQIS. Some parameters of water quality, including pH, in all sources were in standard range. Some of parameters were higher than the standard range, which included:
Turbidity
The turbidity mean in drinking water sources of AqQala villages in the eleven-year period is shown in Figure 2. The rate of turbidity in some sources was higher than the standard range (5 NTU). In 2015, the amount of turbidity was increased.
Figure 2: Amount of turbidity in the drinking water sources of AqQala villages
Ammonium
Figure 3 reveals the mean of ammonium in drinking water sources of AqQala villages in the eleven-year period. The rate of ammonium in all of sources is higher than the standard range (1.5 mg/L). From 2008 onwards the amount of ammonium has been increased.
Figure 3 reveals the mean of ammonium in drinking water sources of AqQala villages in the eleven-year period. The rate of ammonium in all of sources is higher than the standard range (1.5 mg/L). From 2008 onwards the amount of ammonium has been increased.
Figure 3: Concentration of ammonium in the drinking water sources of AqQala villages
Phosphate
Figure 4 shows the mean of phosphate in drinking water sources of AqQala villages in the eleven-year period. The rate of phosphate in all of sources is higher than the standard range (0.2 mg/L). From 2008 onwards the concentration of phosphate has been increased.
Figure 4 shows the mean of phosphate in drinking water sources of AqQala villages in the eleven-year period. The rate of phosphate in all of sources is higher than the standard range (0.2 mg/L). From 2008 onwards the concentration of phosphate has been increased.
Figure 4: Concentration of phosphate in the drinking water sources of AqQala villages
Fluoride
The fluoride mean in the drinking water sources of AqQala villages in the eleven-year periods shown in Figure 5. The rate of fluoride in all of sources is lower than the standard range (1.4-2.4 mg/L). From 2008 onwards the amount of fluoride has been decreased.
The fluoride mean in the drinking water sources of AqQala villages in the eleven-year periods shown in Figure 5. The rate of fluoride in all of sources is lower than the standard range (1.4-2.4 mg/L). From 2008 onwards the amount of fluoride has been decreased.
Figure 5: Concentration of fluoride in the drinking water sources of AqQala villages
Total Hardness
Figure 6 shows the mean of total hardness in the drinking water sources of AqQala villages in the eleven-year period. The total hardness of the groundwater source was very variable (140-576 mg/L). The hardness was related to the amount of sulfate in the groundwater (Figure 6 and 7).
Figure 6 shows the mean of total hardness in the drinking water sources of AqQala villages in the eleven-year period. The total hardness of the groundwater source was very variable (140-576 mg/L). The hardness was related to the amount of sulfate in the groundwater (Figure 6 and 7).
Figure 6: Concentration of total hardness in drinking water sources of AqQala villages
Sulfate
Figure 7 shows the sulfate mean in drinking water sources of AqQala villages in the eleven-year period. The rate of sulfate in all of sources except source number 31 is lower than the standard range (400 mg/L). The sulfate was related to the amount of total hardness in the groundwater.
Figure 7 shows the sulfate mean in drinking water sources of AqQala villages in the eleven-year period. The rate of sulfate in all of sources except source number 31 is lower than the standard range (400 mg/L). The sulfate was related to the amount of total hardness in the groundwater.
Figure 7: Concentration of sulfate in the drinking water sources of AqQala villages
Figure 8: Concentration of nitrate in drinking water sources of AqQala villages
Table 4 shows the GWQI index for drinking water resources in the village of AqQala in 2015. There was no groundwater source with excellent water quality. Sources 6, 9, 10, 15, 30 and 31 had poor qualities and other sources had good qualities. The results show that all sources of drinking water in the villages are deep wells that are located in the southern part of the city. Some parameters of water quality, including pH, calcium, magnesium and potassium in all sources, were in standard range. Some of the parameters were higher than the standard range, included turbidity, ammonium, phosphate and sulfate, chloride, sodium, iron and manganese, silicate and alkalinity.
Figure 9: The GWQI Index for drinking water resources in the village of AqQala in 2015
Table 4: The GWQI Index for drinking water resources in the villages of AqQala in 2015
| Interpretation | GWQI | Number of water source | Interpretation | GWQI | Number of water source |
| Good | 81.62 | 17 | Good | 81.3 | 1 |
| Good | 82.75 | 18 | Good | 53.66 | 2 |
| Good | 65.96 | 19 | Good | 68.29 | 3 |
| Good | 67.21 | 20 | Good | 58.46 | 4 |
| Good | 70.26 | 21 | Good | 99.16 | 5 |
| Good | 64.54 | 22 | Poor | 106.1 | 6 |
| Good | 73.35 | 23 | Good | 59.47 | 7 |
| Good | 83.53 | 24 | Good | 68.96 | 8 |
| Good | 62.05 | 25 | Poor | 118.66 | 9 |
| Good | 63.15 | 26 | Poor | 116.6 | 10 |
| Good | 50.64 | 27 | Good | 94.33 | 11 |
| Good | 53.22 | 28 | Good | 53.9 | 12 |
| Good | 62.74 | 29 | Good | 80.58 | 13 |
| Poor | 107.51 | 30 | Good | 69.39 | 14 |
| Poor | 113.81 | 31 | Poor | 114.78 | 15 |
| - | - | - | Good | 80.8 | 16 |
Discussion
The mean of turbidity in water resources shows that turbidity has increased in some years (Figure 2). The aquifers of AqQala groundwater are mostly fine-grained and have sandstone, and in this area, most of the reservoir has been built for relaxation to solve this problem for all sources of inverter installed, and by installing the inverter device, the sand was reduced, but completely not resolved. The excessive turbidity prevents proper water disinfection and protects microorganisms 20. The rate of ammonium in all of sources is higher than the standard range (1.5 mg/L). From 2008 onwards the amount of ammonium has been increased (figure 3). The high ammonium concentration in all water sources is the probability of entering and infiltration of wastewater from the absorbent wells due to the slope of the area towards AqQala. The study by Doussan et al. shows that high NH4 concentration is related to the heavy organic load in the river and the mineralization of this organic matter by benthic microflora. Among different mechanisms that influence NH4 transport and retention in the porous medium, it emerges the sorption by alluvial sediments 21.The rate of phosphate in all of sources is higher than the standard range (0.2 mg/L). From 2008 onwards the amount of phosphate has been increased (Figure 4).The reason for decreasing the amount of phosphate in some years is the presence of drought. By the way, agricultural activities and sewage leakage from the wells lead to high level of nutrition 22.The rate of fluoride in all of sources is lower than the standard range (1.4-2.4 mg/L).The main source of fluoride in groundwater is rocks which are rich in fluoride. Fluoride occurs in sellaite, fluorite, cryolite, fluorapatite, apatite, fluormica, biotite, amphibole and several other rocks. Low calcium, high sodium and high bicarbonate are typical of high fluoride groundwater. The other sources for fluoride are infiltration of agricultural runoff containing chemical fertilizers, improper disposal of liquid waste from industries, alumina smelting, cement production and ceramic and brick firing. Some amount of fluoride is essential for the human body for healthy teeth and bones 23. Due to the low level of fluoride in all drinking water sources in AqQala villages, fluoridation is recommended to prevent the effects of fluoride deficiency on the human health. The results of this study showed that the concentration of nitrate in the water of AqQala is lower than the standard (Figure8), but the amount of sulfate and hardness is high; since, nitrate can mobilize sulfate from geological pyrite deposits by oxidation of FeSx in the aquifer, leading to a decrease of nitrate and an increase of groundwater sulphate concentrations 22. Some parameters such as sulfate and phosphate have decreased from 2008 to 2013 that is the reason for decreasing the concentration of this parameter in the presence of drought. Although these parameters are reducing, their values in some sources are higher than the standard. The results measured by the GWQI index in groundwater resources showed that the groundwater source was not with excellent water quality. About 19.3% of sources had poor qualities and the other ones had good qualities. As well as some sources (such as 5, 11) had near poor qualities. The results of water quality over the eleven-year period have shown that water quality is reduction. Therefore, comprehensive management of drinking water resources is essential for people's health.
Conclusion
The results of the eleven-year drinking water quality in villages in the city of AqQala indicate that in some cases, such as color, nitrite and nitrate, water quality has improved in recent years compared with previous years due to improved sanitary conditions and sanitation of wastewater. However, some parameters have increased in recent years, including ammonium, phosphate, chlorine, sulfate, hardness and silicate, which indicate the probability of wastewater penetration with regard to the slope of the region from north to south, which requires more extensive studies.
The results of chemical quality showed that all drinking water sources have hard and very hard water. There is also a direct relationship between the degree of hardness and the amount of water sulfate. The amount of fluoride in all drinking water sources is below the standard level. To prevent dental caries in children and adolescents, adding fluoride to water or supplying it with other sources is essential. Considering the limited water resources and the reduction of the quality of resources and the increase of some parameters such as sulfate, hardness, ammonium, water resources management is necessary to prevent the quality reduction and its impact on the health of people and community.
Acknowledgements
This article is part of a master degree thesis in 2017. Particular thanks owed to Lamei Gorgani Institute of Higher Education and Lamei Gorgani University as their supports helped the author to conduct this study.
Funding
This article is part of a thesis from Lamei Gorgani University.
Conflict of interests
No conflict of interest has been stated by the authors.
This is an Open Access article distributed in accordance with the terms of the Creative Commons Attribution (CC BY 4.0) license, which permits others to distribute, remix, adapt and build upon this work for commercial use.
References
1. WHO. Progress and challenges on water and health: the role of the protocol on water and health. Proceedings of the 5th Ministerial Conference on Environment and Health Parma; 2010.
2. Abinandan S, Anand BA, Subramaniam S. Assessment of physico-chemical characteristics of groundwater: A case study. Int J Env Health Eng. 2014; 2(6): 26-33.
3. Bodrud-Doza M, Islam AT, Ahmed F, et al. Characterization of groundwater quality using water evaluation indices, multivariate statistics and geostatistics in central Bangladesh. Water Sci. 2016; 30(1): 19-40.
4. Kalshetty B, Sheth R, Hiremath P, et al. Physicochemical analysis of ground water samples of Jamkhandi town in Bagalkot district, Karnataka state. Int J Chem Sci. 2011; 9(4): 412-20.
5. Reza R, Singh G. Physico-chemical analysis of ground water in Angul-talcher region of Orissa, India. AmJ Sci. 2009; 5(5): 53-8.
6. Wagh CV, Kokate SJ, Aher HR, et al. Physicochemical analysis of ground water in pravara area, district ahmednagar, maharashtra. Rasayan J Chem. 2009; 2(1): 234-42.
7. Shahnawaz M, Singh K. Ground water quality of Piro and Jagdishpur blocks of bhojpur district: A middle gangatic plain. Int J Pharm Quality Assurance. 2009; 1(1): 9-12.
8. Pandey SK, Tiwari S. Physico-chemical analysis of ground water of selected area of Ghazipur city-A case study. Nature and Science. 2009; 7(1): 17-20.
9. Bisht S, Patra B, Gupta N, et al. Assessment of drinking water quality of Delhi, India. Proceedings of the Workshop on Mass Spectrometry; 2007.
10. Pandian RK, Banu GS, Kumar G, et al. Physico-chemical characteristics of drinking water in selected areas of Namakkal town (Tamil Nadu), India. Indian J Environ Protection. 2005; 10(3): 789-92.
11. Rajan M, Paneerselvam I. Evaluation of drinking water quality in Dindigul city, Tamil Nadu. Indian J Environ and Ecoplan. 2005; 10(3): 771-6.
12. Thakare S, Parwate A, Rao M. Analysis of fluoride in the groundwater of akola district: A case study. Adv Ecol Res. 2006; 12(8):128-39.
13. Nabizadeh R, Amin MV, Alimohammadi M,
et al. Development of innovative computer software to facilitate the setup and computation of water quality index. J Env Health Sci and Eng. 2013;11(1):1-10.
14. Ramakrishnaiah C, Sadashivaiah C, Ranganna G. Assessment of water quality index for the groundwater in Tumkur Taluk, Karnataka State, India. J of Chemistry. 2009; 6(2): 523-30.
15. Shahid SU, Iqbal J, Hasnain G. Groundwater quality assessment and its correlation with gastroenteritis using GIS: A case study of Rawal Town, Rawalpindi, Pakistan. Environ Monit Assess. 2014; 186(11): 7525-37.
16. Singh P, Tiwari A, Panigarhy B, et al. Water quality indices used for water resources vulnerability assessment using GIS technique:
A review. Int J Earth Sci Eng. 2013; 6(6):
1594-600.
17. Vasanthavigar M, Srinivasamoorthy K, Vijayaragavan K, et al. Application of water quality index for groundwater quality assessment: Thirumanimuttar sub-basin, Tamilnadu, India. Environ Monit Assess. 2010; 171 (1): 595-609.
18. Sadeghi M, Bay A, Bay N, et al. The effect of agriculture drainage on water quality of the Zaringol in Golestan province by the water quality index. Res in Env Health. 2015; 1(3): 177-85.
19. Federation WE, APH. Standard methods for the examination of water and wastewater. American Public Health Association (APHA): Washington, DC, USA. 2005.
20. Crump J, Okoth G, Slutsker L, et al. Effect of point‐of‐use disinfection, flocculation and combined flocculation–disinfection on drinking water quality in western Kenya. J Appl Microbiol. 2004; 97(1): 225-31.
21. Doussan C, Ledoux E, Detay M. River-groundwater exchanges, bank filtration, and groundwater quality: Ammonium behavior. J Env Quality.1998; 27(6): 1418-27.
22. Smolders AJ, Lucassen EC, Bobbink R, et al. How nitrate leaching from agricultural lands provokes phosphate eutrophication in groundwater fed wetlands: The sulphur bridge. Biogeochemistry. 2010; 98(1-3): 1-7.
23. Brindha K, Elango L. Fluoride in Groundwater: Causes, Implications and Mitigation Measures in: Monroy, S.D. Fluoride Properties, Applications and Environmental. Jalandhar City : Nova; 2011.
Type of Study: Original articles |
Subject:
Special
Received: 2017/10/25 | Accepted: 2018/01/20 | Published: 2018/03/14
Received: 2017/10/25 | Accepted: 2018/01/20 | Published: 2018/03/14
Send email to the article author
| Rights and permissions | |
 |
This work is licensed under a Creative Commons Attribution-NonCommercial 4.0 International License. |
