

Volume 7, Issue 2 (June 2022)
J Environ Health Sustain Dev 2022, 7(2): 1660-1675 |
Back to browse issues page


Download citation:
BibTeX | RIS | EndNote | Medlars | ProCite | Reference Manager | RefWorks
Send citation to:


BibTeX | RIS | EndNote | Medlars | ProCite | Reference Manager | RefWorks
Send citation to:
Karimzadeh M, Bagheri Lotfabad T, Heydarinasab A, Yaghmaei S. Biodecolourization of Azo Dye under Extreme Environmental Conditions via Klebsiella quasipneumoniae GT7: Mechanism and Efficiency. J Environ Health Sustain Dev 2022; 7 (2) :1660-1675
URL: http://jehsd.ssu.ac.ir/article-1-424-en.html
URL: http://jehsd.ssu.ac.ir/article-1-424-en.html


Department of Industrial and Environmental Biotechnology, National Institute of Genetic Engineering and Biotechnology (NIGEB), Tehran, Iran.
Full-Text [PDF 972 kb]
(368 Downloads)
| Abstract (HTML) (1118 Views)
Effect of NaCl concentration on dye removal
Figure 2 indicates that the spectrophotometry method through the calibration curve estimates the dye concentration to be 44.6 mg/l in YS+C,50ppm at the beginning of incubation in the absence of NaCl. Therefore, 44.6 mg/l is considered the initial dye concentration in YS+C,50ppm mediums to eliminate any error caused by spectrophotometry measurements. Accordingly, Figure 2 shows that in YS+C,50ppm medium containing NaCl between 0-12 % and 15-30%, respectively, ≃1-4 mg/l and ≃8-22 mg/l of initial dye was salted out at the beginning of incubation in control experiments. These salted out dyes did not significantly increase during 48h of incubation, but only some fluctuations occurred due to dynamic assimilation/dissimilation of dye particles affected by ionic strength imposed by NaCl in the medium.
.PNG)
Figure 2: Effect of various NaCl concentrations on dye removal from YS+C,50ppm medium, (a) inoculated with K. quasipneumoniae GT7 and (b) non-inoculated (control) experiments during static incubation at 30°C
.PNG)
Figure 3: Effect of different initial pH values of medium on growth of K. quasipneumoniae GT7 in YS medium under static conditions at 30°C
.PNG)
Figure 4: Effect of different initial pH values on dye removal from YS+C,50ppm medium, (a) inoculated with K. quasipneumoniae GT7 and (b) non-inoculated (control) experiments during static incubation at 30°C
Figure 4 indicates that GT7 cells incubated in YS+C,50ppm under intense acidic stress of pH 3, removed dye (≃23 mg/l) after 5 h of incubation, attaining ≃27 mg/l after 48 h. It should be noted that only ≃7 mg/l of Carmoisine was removed during 48 h in the corresponding control experiment (Figure 4). However, TLC analysis revealed dye spots for both inoculated and non-inoculated samples after 48 h of incubation (Figure A4). Moreover, Figure A5 shows dye adsorption on the cell surface of bacteria during the incubation in YS+C,50ppm under initial pH 3.
Once pH was adjusted to 4, during 48 h of incubation, ≃38 mg/l of the dye was removed (Figure 4) and fluorescent spots of aromatic amines appeared on TLC (Figure A4). It is noteworthy that after 96 h of incubation, Carmoisine was completely removed from YS+C,50ppm medium incubated under initial pH 4 and no adsorbed dye remained on the cell pellets (data not shown). Table 4 reveals that although (OD600nm)48h increased under initial pH 3 and pH 4, indicating that the growth of cells leads to the release of acidic metabolites into the medium, the pH of the medium not only did not decrease but also slightly increased.
In addition, Figure 4 represents that once the initial pH was adjusted to 12, after 20 h of incubation; ≃24 mg/l of dye was removed, reaching ≃31mg/l during 48 h. This is while the maximum dye removal was ≃9mg/l for corresponding control experiments during 48 h. On the other hand, cell viability decreased four logarithmic units after 48 h of incubation under pH 12 (Table 3).(OD600nm)48h and pH measurements given in Table 4 show no growth and negligible pH fluctuations during incubation of GT7 in YS+C,50ppm medium under pH 12.
Scanning electron microscopy
Figure 5 shows the morphology of bacteria collected from different culture media, including bacteria grown in YTS for 21 h, bacteria grown in YS+C,50ppm containing NaCl (0%, 15% and 30%) during 5h of incubation, as well as bacteria cultivated in YS+C,50ppm with pH 3, 7, and 12, grown for 5 h. SEM (Figure 5) indicated that both salinity and pH stresses gave rise to the morphological transition in K. quasipneumoniae GT7 cells from rod- to coccoid-shaped.
.PNG)
Figure 5: Scanning electron micrographs (magnification 5000X) of K. quasipneumoniae GT7 (a) grown in YTS for 21 h at 30°C and 180 rpm and grown during static incubation in YS+C,50ppm medium for 5 h under conditions of (b) pH = 7.1, NaCl 0%, (c) pH = 7.1, NaCl 15%, (d) pH = 7.1, NaCl 30%, (e) pH = 3, NaCl 0%, (f) pH = 11, NaCl 0%, and (g) pH = 12, NaCl 0%
Appendix
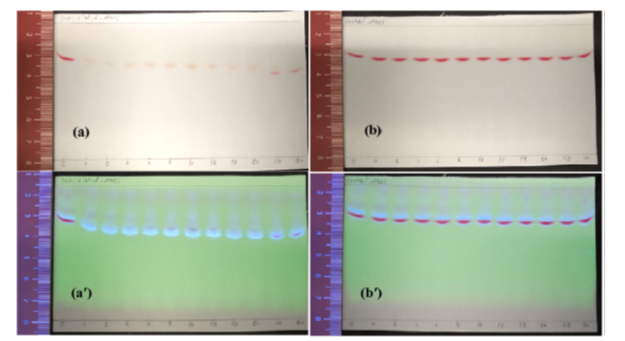
Figure A1: Display of TLC sheet samples extracted fromYS+C,50ppm medium under various NaCl concentrations (0, 2%, 4%, 6%, 8%, 10%, 12%, 15%, 20%, 25% and 30%), (a & a′) inoculated with K. quasipneumoniae GT7 and (b & b′) not inoculated (control experiments) and statically incubated at 30°C for 48 h. Sheets were visualized under visible (a & b) and UV (a′ & b′) lights. The letter ″C″ on sheets stands for extract from YS+C,50ppm medium at the time of zero.
.PNG)
Figure A2: Cell pellets collected from inoculated YS+C,50ppm medium including NaCl at different concentrations (0-30%) after 48 h of inoculation with K. quasipneumoniae GT7 and static incubation at 30°C.
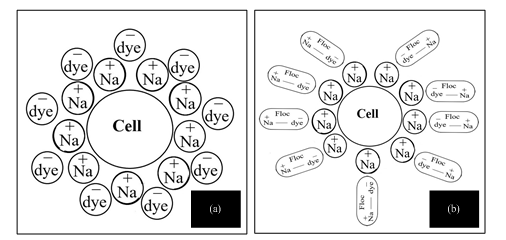
Figure A3: Arrangement of Na+ ions and dye molecules surrounding cells of K. quasipneumoniae GT7, inYS+C,50ppm medium including NaCl, where, dye is (a) in dissolved form and (b) in salted out form with NaCl.
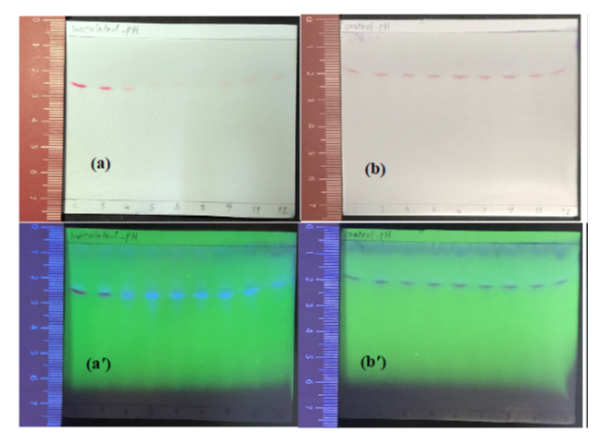
Figure A4: Display of TLC sheet samples extracted fromYS+C,50ppm medium with pH adjusted to different values (3, 4, 5, 6, 7, 9, 11, and 12), (a & a′) inoculated with K. quasipneumoniae GT7 and (b & b′) not inoculated (control experiments) and statically incubated at 30°C for 48 h. Sheets were visualized under visible (a & b) and UV (a′ & b′) lights. The letter ″C″ on sheets stands for extract from YS+C,50ppm medium at the time of zero.
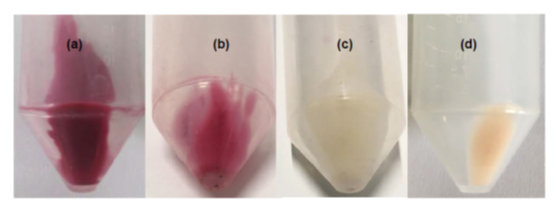
Figure A5: Cell pellets collected from inoculated YS+C,50ppm medium with initial pH adjusted to (a) 3, (b) 4, (c) 5-11 and (d) 12 after 48 h of inoculation with K. quasipneumoniae GT7 and static incubation at 30°C.
Full-Text: (765 Views)
Biodecolourization of Azo Dye under Extreme Environmental Conditions via Klebsiella quasipneumoniae GT7: Mechanism and Efficiency
Maryam Karimzadeh 1, Tayebe Bagheri Lotfabad 2*, Amir Heydarinasab 1, Soheila Yaghmaei 3
1 Department of Chemical Engineering, Science and Research Branch, Islamic Azad University, Tehran, Iran.
2 Department of Industrial and Environmental Biotechnology, National Institute of Genetic Engineering and Biotechnology (NIGEB), Tehran, Iran.
3 Department of Chemical and Petroleum Engineering, Sharif University of Technology, Tehran, Iran.
| A R T I C L E I N F O | ABSTRACT | |
| ORIGINAL ARTICLE | Introduction: Biodegradation of azo dyes under harsh environmental conditions has been of great interest for the treatment of colored effluents. The present study aims to evaluate Klebsiella quasipneumoniae GT7 for degrading azo dye Carmoisine under extreme pH conditions and high salinity. Materials and Methods: The growth profiles of bacteria were compared under different conditions of salinity and pH, using the optical density and viability measurements. Kinetic patterns of decolourization by GT7 were investigated under different concentrations of NaCl and/or pH, through the spectrophotometry method. Moreover, thin layer chromatography (TLC) was used to evaluate the biotransformation of Carmoisine into aromatic amines. Scanning electron microscopy (SEM) was carried out to analyze any morphological changes in bacteria under stress conditions. Results: GT7 showed OD-based growth and sustainable viability under [NaCl] ≤ 15% and/or initial pH between 3-11. The viable but nonculturable (VBNC) state explained the bacteria's survival under attenuated growth due to bacterial inefficiency to maintain cytoplasmic osmotic balance, vital turgor pressure, and pH homeostasis. Biodecolourization was accomplished during 48h, where Carmoisine was 50mg/l, [NaCl] ≤ 20%, and/or initial was pH 5-11. TLC, OD600nm and pH measurements as well as visual observation of bacterial pellets at the end of the decolourization confirmed biodegradation as the dominant mechanism, except for pH 3, where dye was removed via adsorption to the cell surface. SEM showed morphological alteration of GT7 from rod to coccoid shape as an approach to resist the harsh conditions ratio. Conclusion: GT7 is shown as an efficient strain for azo dye degradation in harsh environmental conditions. |
|
Article History: Received: 11 February 2022 Accepted: 20 April 2022 |
||
*Corresponding Author: Tayebe Bagheri Lotfabad Email: bagheril@nigeb.ac.ir Tel: +982144787321 |
||
Keywords: Azo Compounds, Klebsiella, Salinity, Extremophiles, Coloring Agents. |
Citation: Karimzadeh M, Bagheri Lotfabad T, Heydarinasab A, et al. Biodecolourization of Azo Dye under Extreme Environmental Conditions via Klebsiella quasipneumoniae GT7: Mechanism and Efficiency. J Environ Health Sustain Dev. 2022; 7(2): 1660-75.
Introduction
Azo dyes, comprising a large share of the synthetic dye market, are widely found in wastewaters from different industries; particularly textile, printing, food, and soft drink industries. Untreated colored effluents pose a great threat to aquatic life due to the recalcitrance and toxicity of synthetic dyes. Colored effluents from dye manufacturing industries and/or dye consuming industries usually include high salt concentrations up to 15–20% 1. Biodegradation due to its cost-effectiveness and environmental sustainability as well as its lower sludge production has been recognized as the preferential method in dealing with colored effluents 2,3. However, conventional biological treatments are incapable of treating hypersaline and/or wastewaters with various pH levels 4,5. Sodium concentrations beyond 3 g l-1 may moderately inhibit most bacterial functions 1. High NaCl concentrations affect osmotic pressure in bacteria leading to plasmolysis and/or loss of cell activity as well as reduced survival rate 1,6,7. Accordingly, desalination pre-treatment of wastewaters is necessary to avoid high salinity in biological treatment units 1. However, expensive pretreatments may be replaced by extremophile bacteria in wastewater treatment plants.
Earlier reports have shown that salt-tolerant microorganisms could maintain relatively high efficiency even under saline conditions. It could be due to the fact that they include different protective strategies to keep the osmotic balance of the cytoplasm and thereby maintain vital turgor pressure 8–11.
In previous studies, a number of bacterial strains have been reported which were capable of removing azo dye from colored effluent in the presence of salt. In this regard, two strains of Halomonas showed more than 90% decolorization of Remazol black B (50 mg l-1) during 4 days under conditions of 34°C, pH = 7.2, and salinity up to 20% NaCl 12. Shewanella putrefaciens AS96 under static conditions at 35°C in the presence of NaCl (6%) attained a removal of 100% for Reactive Black-5 and Direct Red-81, 53% for Acid Red-88, and 58% for Disperse Orange-3 within 24 h, respectively 13. However, to the best of the authors’ knowledge, very few studies have investigated the mechanism of bacterial dye removal under extreme conditions. Also, little if any of this research has proposed the contribution of dye flocculation or salting out of dye in calculations of biological dye removal. Only Xu et al. 14 proposed that two mechanisms, including biodegradation and bioflocculation were involved in the removal of Xylidine Ponceau 2R by Shewanella marisflavi EP1 in the presence of NaCl more than 10%. Although salting out of dye was considered in decolourization capacity calculations by Guo et al. 3, the interactions between microbial activities and salting out were not discussed.
The present study aims to examine Klebsiella quasipneumoniae GT7 for biodecolourization under harsh environmental conditions of salinity and pH. The previously isolated strain GT7 demonstrated efficient biodegradation of the sulfonic azo dye, Carmoisine 15. In this study, the growth and viability of bacteria were investigated under high salinity and harsh pH conditions. Dye removal efficiencies were estimated in different conditions through spectrophotometry. OD600nm and pH variations were measured during dye removal processes. Thin layer chromatography (TLC) was used to evaluate degradation of azo dye into aromatic amines. Dye removal mechanisms under different conditions, including flocculation, biodegradation and adsorption were examined, and scanning electron microscopy (SEM) investigated morphological alteration of GT7 cells during dye removal processes.
Materials and Methods
Dye and chemicals
Carmoisine (IDACOL - ROHA) was of commercial grade and donated by Vista Zar Co. All chemicals and reagents were of analytical grade and obtained from Merck KGaA (Germany) except where otherwise stated. Commercial sucrose (white sugar (Pardis brand)) was purchased from Golestan Co.
Bacterial strain and cultivation
This study used Klebsiella quasipneumoniae GT7 (GenBank accession number KY357316) isolated from expired date palm liquid which demonstrated high efficiency in degradation of azo dye in the authors’ previous study 15.
The YTS medium containing yeast extract 1% (w/v), tryptone (casein hydrolysate) 2% (w/v) and sucrose 2% (w/v) was used to cultivate bacteria. Plates of YTS-agar (2%, w/v) were used to grow bacteria on solid medium and incubated at 30°C for 23-24 h.
Bacterial inoculates were prepared by cultivation of bacteria cells in YTS medium and incubated at 30°C and 180 rpm for 19-21 h to reach ≃250 × 108 CFU/ml. Viable cells in bacterial suspension were estimated as colony-forming units (CFUs) per milliliter of culture.
Investigation of bacterial growth under different NaCl concentrations and pH
The growth profiles of bacteria were compared in YS medium under different conditions of salinity and pH. To this end, K. quasipneumoniae GT7 was grown aerobically in YTS medium in a 1-L flask for 19-21 h to reach a cell viability of ≃ 250 × 108 CFU/ml, then was inoculated into 50-ml falcon tubes containing 45 ml YS as 5% v/v. The experiments were performed in two sets. In one set, NaCl was added to YS medium at concentrations of 0%, 2%, 4%, 6%, 8%, 10%, 12%, 15%, 20%, 25%, and 30%. In the other set, initial pH of YS mediums was adjusted to 3, 4, 5, 6, 7, 9, 11, and 12. All the experiments were carried out statically at 30°C. Samples were obtained at specified time intervals and evaluated for bacterial growth using optical density measurements (OD600nm). Viable cells were estimated after 5 h and 48 h of incubation as CFUs per milliliter of culture 16.
Decolourization experiments
Temporal patterns of dye content in YS+C,50ppm were investigated under different concentrations of NaCl and/or pH, where YS+C,50ppm refers to YS medium which included Carmoisine at a concentration of 50 mg/l. At first, K. quasipneumoniae GT7 was cultivated aerobically in YTS medium in a 1-L flask for 19-21 h to obtain a cell viability of ≃ 250 × 108 CFU/ml, and was then inoculated into 100-ml Duran bottles containing 90 mL YS+C,50ppm as 5% v/v. The experiments were performed in two sets. In one set, the effects of salinity were investigated; to this end, NaCl was added to YS+C,50ppm medium in concentrations of 0%, 2%, 4%, 6%, 8%, 10%, 12%, 15%, 20%, 25%, and 30%. In the other set, the effect of initial pH was studied by adjusting the initial pH of YS+C,50ppm mediums to 3, 4, 5, 6, 7, 9, 11, and 12 via 6M NaOH and 6M HCl solutions. All the experiments were carried out statically at 30°C. During the process, dye reduction was monitored by spectrophotometry and visually along with photography. The samples taken at prescribed time intervals were centrifuged (16,060 × g, for 10 min) to remove the cell pellets. The cell-free supernatants were scanned in the wavelength range of 200-800 nm using T80 + UV/Vis spectrometer (PG Instruments Ltd) and absorbance at the maximum absorption wavelength of Carmoisine, λmax = 515 nm, was recorded. Dye removal efficiency was estimated as (A0-At)/A0, where A0 and At are the absorbance at 515nm for samples prepared at initial and t of incubation, respectively. After 48 h of incubation, bacterial growth was estimated as the difference between OD600nm measured for each sample before and after centrifugation 3. Moreover, the culture media pH was measured after 48h of incubation and compared with the initial pH to determine how the metabolites produced during the process changed the culture acidity. The 48-h samples were examined for transformation of Carmoisine into aromatic amines through the TLC method explained in detail by Kiayi et al. 17. Therefore, the cell-free samples were acidified and extracted by n-butanol, then the concentrated solvent-extracts were spotted and run on TLC sheets (Merck) in a mixed solvent system of butanol:water:acetic acid (2:2:1). The results were investigated under visible and UV lights (312 nm). Control experiments were also carried out using non-inoculated mediums to eliminate interfering non-microbial factors in dye removal.
Scanning electron microscopy
Microscopic investigations were carried out to analyze any morphological changes in bacteria under stress conditions. This study was conducted on bacteria collected from different culture media, including bacteria grown in YTS for 21 h, bacteria grown in YS+C,50ppm containing NaCl (0%, 15% and 30%) during 5h of incubation as well as bacteria cultivated in YS+C,50ppm with pH levels of 3, 7, and 12, grown for 5 h. For all the samples, bacteria were centrifuged (4000 rpm, 10 min) and subsequently twice washed with saline, fixed with glutaraldehyde and dehydrated with a set of ethanol solutions using the method explained by Vatandoostarani 18. The prepared samples were investigated using SEM via the VEGA3 TESCAN SEM.
Data analysis
All the experiments were repeated at least three times. The results are represented as mean ± standard error of mean, calculated by Excel 2007. The error bars shown on the graphs represent plus and minus one standard error from the mean.
Results
Effect of NaCl concentration on growth
Figure 1 indicates that the growth rate of the logarithmic phase and maximum OD-based
growth in the stationary phase were approximately the same for 0-4% NaCl. However, NaCl concentrations of 6-8% caused a decrease in both rates of log-growth phase and maximum cell density in the stationary phase. These reductions were more pronounced at 10% and 12% NaCl concentrations. Furthermore, growth was not detected for NaCl 15%-30% by OD600nm.
.PNG)
Figure 1: Effect of various NaCl concentrations on growth of K. quasipneumoniae GT7 in YS medium under static conditions at 30°C
Azo dyes, comprising a large share of the synthetic dye market, are widely found in wastewaters from different industries; particularly textile, printing, food, and soft drink industries. Untreated colored effluents pose a great threat to aquatic life due to the recalcitrance and toxicity of synthetic dyes. Colored effluents from dye manufacturing industries and/or dye consuming industries usually include high salt concentrations up to 15–20% 1. Biodegradation due to its cost-effectiveness and environmental sustainability as well as its lower sludge production has been recognized as the preferential method in dealing with colored effluents 2,3. However, conventional biological treatments are incapable of treating hypersaline and/or wastewaters with various pH levels 4,5. Sodium concentrations beyond 3 g l-1 may moderately inhibit most bacterial functions 1. High NaCl concentrations affect osmotic pressure in bacteria leading to plasmolysis and/or loss of cell activity as well as reduced survival rate 1,6,7. Accordingly, desalination pre-treatment of wastewaters is necessary to avoid high salinity in biological treatment units 1. However, expensive pretreatments may be replaced by extremophile bacteria in wastewater treatment plants.
Earlier reports have shown that salt-tolerant microorganisms could maintain relatively high efficiency even under saline conditions. It could be due to the fact that they include different protective strategies to keep the osmotic balance of the cytoplasm and thereby maintain vital turgor pressure 8–11.
In previous studies, a number of bacterial strains have been reported which were capable of removing azo dye from colored effluent in the presence of salt. In this regard, two strains of Halomonas showed more than 90% decolorization of Remazol black B (50 mg l-1) during 4 days under conditions of 34°C, pH = 7.2, and salinity up to 20% NaCl 12. Shewanella putrefaciens AS96 under static conditions at 35°C in the presence of NaCl (6%) attained a removal of 100% for Reactive Black-5 and Direct Red-81, 53% for Acid Red-88, and 58% for Disperse Orange-3 within 24 h, respectively 13. However, to the best of the authors’ knowledge, very few studies have investigated the mechanism of bacterial dye removal under extreme conditions. Also, little if any of this research has proposed the contribution of dye flocculation or salting out of dye in calculations of biological dye removal. Only Xu et al. 14 proposed that two mechanisms, including biodegradation and bioflocculation were involved in the removal of Xylidine Ponceau 2R by Shewanella marisflavi EP1 in the presence of NaCl more than 10%. Although salting out of dye was considered in decolourization capacity calculations by Guo et al. 3, the interactions between microbial activities and salting out were not discussed.
The present study aims to examine Klebsiella quasipneumoniae GT7 for biodecolourization under harsh environmental conditions of salinity and pH. The previously isolated strain GT7 demonstrated efficient biodegradation of the sulfonic azo dye, Carmoisine 15. In this study, the growth and viability of bacteria were investigated under high salinity and harsh pH conditions. Dye removal efficiencies were estimated in different conditions through spectrophotometry. OD600nm and pH variations were measured during dye removal processes. Thin layer chromatography (TLC) was used to evaluate degradation of azo dye into aromatic amines. Dye removal mechanisms under different conditions, including flocculation, biodegradation and adsorption were examined, and scanning electron microscopy (SEM) investigated morphological alteration of GT7 cells during dye removal processes.
Materials and Methods
Dye and chemicals
Carmoisine (IDACOL - ROHA) was of commercial grade and donated by Vista Zar Co. All chemicals and reagents were of analytical grade and obtained from Merck KGaA (Germany) except where otherwise stated. Commercial sucrose (white sugar (Pardis brand)) was purchased from Golestan Co.
Bacterial strain and cultivation
This study used Klebsiella quasipneumoniae GT7 (GenBank accession number KY357316) isolated from expired date palm liquid which demonstrated high efficiency in degradation of azo dye in the authors’ previous study 15.
The YTS medium containing yeast extract 1% (w/v), tryptone (casein hydrolysate) 2% (w/v) and sucrose 2% (w/v) was used to cultivate bacteria. Plates of YTS-agar (2%, w/v) were used to grow bacteria on solid medium and incubated at 30°C for 23-24 h.
Bacterial inoculates were prepared by cultivation of bacteria cells in YTS medium and incubated at 30°C and 180 rpm for 19-21 h to reach ≃250 × 108 CFU/ml. Viable cells in bacterial suspension were estimated as colony-forming units (CFUs) per milliliter of culture.
Investigation of bacterial growth under different NaCl concentrations and pH
The growth profiles of bacteria were compared in YS medium under different conditions of salinity and pH. To this end, K. quasipneumoniae GT7 was grown aerobically in YTS medium in a 1-L flask for 19-21 h to reach a cell viability of ≃ 250 × 108 CFU/ml, then was inoculated into 50-ml falcon tubes containing 45 ml YS as 5% v/v. The experiments were performed in two sets. In one set, NaCl was added to YS medium at concentrations of 0%, 2%, 4%, 6%, 8%, 10%, 12%, 15%, 20%, 25%, and 30%. In the other set, initial pH of YS mediums was adjusted to 3, 4, 5, 6, 7, 9, 11, and 12. All the experiments were carried out statically at 30°C. Samples were obtained at specified time intervals and evaluated for bacterial growth using optical density measurements (OD600nm). Viable cells were estimated after 5 h and 48 h of incubation as CFUs per milliliter of culture 16.
Decolourization experiments
Temporal patterns of dye content in YS+C,50ppm were investigated under different concentrations of NaCl and/or pH, where YS+C,50ppm refers to YS medium which included Carmoisine at a concentration of 50 mg/l. At first, K. quasipneumoniae GT7 was cultivated aerobically in YTS medium in a 1-L flask for 19-21 h to obtain a cell viability of ≃ 250 × 108 CFU/ml, and was then inoculated into 100-ml Duran bottles containing 90 mL YS+C,50ppm as 5% v/v. The experiments were performed in two sets. In one set, the effects of salinity were investigated; to this end, NaCl was added to YS+C,50ppm medium in concentrations of 0%, 2%, 4%, 6%, 8%, 10%, 12%, 15%, 20%, 25%, and 30%. In the other set, the effect of initial pH was studied by adjusting the initial pH of YS+C,50ppm mediums to 3, 4, 5, 6, 7, 9, 11, and 12 via 6M NaOH and 6M HCl solutions. All the experiments were carried out statically at 30°C. During the process, dye reduction was monitored by spectrophotometry and visually along with photography. The samples taken at prescribed time intervals were centrifuged (16,060 × g, for 10 min) to remove the cell pellets. The cell-free supernatants were scanned in the wavelength range of 200-800 nm using T80 + UV/Vis spectrometer (PG Instruments Ltd) and absorbance at the maximum absorption wavelength of Carmoisine, λmax = 515 nm, was recorded. Dye removal efficiency was estimated as (A0-At)/A0, where A0 and At are the absorbance at 515nm for samples prepared at initial and t of incubation, respectively. After 48 h of incubation, bacterial growth was estimated as the difference between OD600nm measured for each sample before and after centrifugation 3. Moreover, the culture media pH was measured after 48h of incubation and compared with the initial pH to determine how the metabolites produced during the process changed the culture acidity. The 48-h samples were examined for transformation of Carmoisine into aromatic amines through the TLC method explained in detail by Kiayi et al. 17. Therefore, the cell-free samples were acidified and extracted by n-butanol, then the concentrated solvent-extracts were spotted and run on TLC sheets (Merck) in a mixed solvent system of butanol:water:acetic acid (2:2:1). The results were investigated under visible and UV lights (312 nm). Control experiments were also carried out using non-inoculated mediums to eliminate interfering non-microbial factors in dye removal.
Scanning electron microscopy
Microscopic investigations were carried out to analyze any morphological changes in bacteria under stress conditions. This study was conducted on bacteria collected from different culture media, including bacteria grown in YTS for 21 h, bacteria grown in YS+C,50ppm containing NaCl (0%, 15% and 30%) during 5h of incubation as well as bacteria cultivated in YS+C,50ppm with pH levels of 3, 7, and 12, grown for 5 h. For all the samples, bacteria were centrifuged (4000 rpm, 10 min) and subsequently twice washed with saline, fixed with glutaraldehyde and dehydrated with a set of ethanol solutions using the method explained by Vatandoostarani 18. The prepared samples were investigated using SEM via the VEGA3 TESCAN SEM.
Data analysis
All the experiments were repeated at least three times. The results are represented as mean ± standard error of mean, calculated by Excel 2007. The error bars shown on the graphs represent plus and minus one standard error from the mean.
Results
Effect of NaCl concentration on growth
Figure 1 indicates that the growth rate of the logarithmic phase and maximum OD-based
growth in the stationary phase were approximately the same for 0-4% NaCl. However, NaCl concentrations of 6-8% caused a decrease in both rates of log-growth phase and maximum cell density in the stationary phase. These reductions were more pronounced at 10% and 12% NaCl concentrations. Furthermore, growth was not detected for NaCl 15%-30% by OD600nm.
Figure 1: Effect of various NaCl concentrations on growth of K. quasipneumoniae GT7 in YS medium under static conditions at 30°C
Moreover, the viability of cells estimated at 5 h and 48 h of incubation in the presence of NaCl between 0-30% is shown in Table 1. For NaCl less than or equal to 8%, viability increased to some extent during 5 h of incubation, but decreased one logarithmic order after 48 h of incubation. For NaCl higher than 8%, cell viability decreased one logarithmic unit after 5h of incubation and a slight descending trend continued until 48 h. A greater decrease in cell viability (three logarithmic units) was observed for NaCl higher than 15% after
48 h.
48 h.
Table 1: Viable cells of K. quasipneumoniae GT7 grown statically in YS medium, including various NaCl concentrations after 5 h and 48 h of incubation at 30°C, where inoculated cells were 130×107 CFU/ml
| NaCl concentration (%) | CFU/ml | |
| 5 h | 48 h | |
| 0 | (229 ± 1.9) × 107 | (120 ± 0.9) × 106 |
| 2 | (236 ±7.4) × 107 | (125 ± 2.8) × 106 |
| 4 | (234 ± 4.8) × 107 | (123 ± 1.6) × 106 |
| 6 | (197 ± 3.2) × 107 | (109 ± 0.7) × 106 |
| 8 | (178 ± 2.7) × 107 | (101 ± 1.2) × 106 |
| 10 | (270 ± 3) × 106 | (98 ± 0.5) × 106 |
| 12 | (258 ± 3.2) × 106 | (82 ± 1.2) × 106 |
| 15 | (240 ± 3.7) × 106 | (69 ± 1.6) × 106 |
| 20 | (192 ± 0.9) × 106 | (64 ± 1) × 104 |
| 25 | (187 ± 1.4) × 106 | (63 ± 0.9) × 104 |
| 30 | (180 ± 2.5) × 106 | (59 ± 0.9) × 104 |
Effect of NaCl concentration on dye removal
Figure 2 indicates that the spectrophotometry method through the calibration curve estimates the dye concentration to be 44.6 mg/l in YS+C,50ppm at the beginning of incubation in the absence of NaCl. Therefore, 44.6 mg/l is considered the initial dye concentration in YS+C,50ppm mediums to eliminate any error caused by spectrophotometry measurements. Accordingly, Figure 2 shows that in YS+C,50ppm medium containing NaCl between 0-12 % and 15-30%, respectively, ≃1-4 mg/l and ≃8-22 mg/l of initial dye was salted out at the beginning of incubation in control experiments. These salted out dyes did not significantly increase during 48h of incubation, but only some fluctuations occurred due to dynamic assimilation/dissimilation of dye particles affected by ionic strength imposed by NaCl in the medium.
Figure 2: Effect of various NaCl concentrations on dye removal from YS+C,50ppm medium, (a) inoculated with K. quasipneumoniae GT7 and (b) non-inoculated (control) experiments during static incubation at 30°C
For NaCl concentrations between 0 to 8%, along with bacterial growth, ≃40-43 mg/l of initial dye in YS+C,50ppm was removed during 40 h and dye concentration decreased to less than 4 mg/l where decolourization was visually observed in bottles (Figure 2). No significant change was observed in dye concentration from 40 h to 48 h. This is while less than 4 mg/l of initial dye was removed in corresponding control experiments under the same conditions. TLC revealed fluorescent spots for samples of 48 h–inoculated medium under 0-8% NaCl, demonstrating formation of aromatic amines where Carmoisine spots appeared in corresponding control experiments (Figure A1). Therefore, biological transformation of Carmoisine was confirmed by K. quasipneumoniae GT7 under NaCl 0-8%.
For medium YS+C,50ppm with NaCl 10% and 12%, ≃40 mg/l of initial dye was removed during 40 h and 30 h, respectively, and dye decreased to ≃4 mg/l where dye concentration was estimated at 37 mg/l in corresponding control experiments (Figure 2). No significant change was detected in dye concentration after 40 h. Furthermore, fluorescent spots on TLC appearing for samples of inoculated medium which included NaCl 10-12% (Figure A1) revealed biotransformation of Carmoisine by GT7 under NaCl 10-12%. Figure A2 indicates that no dye particle was detected in cell pellets harvested after 48 h of incubation under NaCl 10-12%. The hypothesized Na+ layer mediating the biodecolourization under NaCl 10-12% is shown in Figure A3.
At NaCl 15%, growth was suppressed based on OD600nm and viability was slightly reduced. While, decolourization rate accelerated, in a way that decolourization was visually observed at 20 h of inoculation where dye concentration was estimated ≃10 mg/l. However, for NaCl < 15% dye concentration was ≃14-20 mg/l (Figure 2). During 40 h of incubation, dye concentration decreased to ≃4 mg/l, which did not change significantly up to 48 h. Furthermore, TLC analysis revealed fluorescent spots of aromatic amines for inoculated samples after 48 h of incubation under 15% NaCl (Figure A1). In corresponding control experiments, dye concentration decreased to ≃22 mg/l during 48 h of incubation. At NaCl concentrations higher than 15%, viable cells decreased 3 logarithmic units (Table 1); therefore, biological manifestations decelerated in the medium. In this way, dye concentration decreased to 4 mg/l and 7 mg/l in inoculated mediums after 48 h under NaCl 20% and 25%-30%, respectively (Figure 2). Fluorescent spotting of aromatic amines was detected on TLC sheet for samples of inoculated medium containing NaCl 20%, where Carmoisine spots appeared when NaCl was 25%-30% (Figure A1). However, in corresponding non-inoculated samples, dye decreased to 15-20 mg/l during 48 h, where NaCl was 20-30% (Figure 2). Moreover, coagulated dye particles appeared in cell pellets collected after 48 h of incubation under NaCl higher than 20% and proliferated with an increase in NaCl concentration (Figure A2).
Overall, measurements revealed that for all inoculated YS+C,50ppm mediums, including different concentrations of salt, after 48 h of incubation, (OD600nm)48h increased in comparison to the initial value (≃0.52) and pH decreased in comparison to the initial adjusted value (7.1) (Table 2).
Table 2: OD600nm and pH measurements for YS+C,50ppm after 48h of inoculation with K. quasipneumoniae GT7 incubated under different NaCl concentrations, where initial OD600nm was ≃0.52 and initial pH was adjusted to 7.1
| NaCl concentration (%) | (OD600nm)48h | pH48h |
| 0 | 1.721 ± 0.134 | 4.90 ± 0.00 |
| 2 | 1.787 ± 0.129 | 4.61 ± 0.00 |
| 4 | 1.677 ± 0.140 | 4.90 ± 0.04 |
| 6 | 1.473 ± 0.164 | 5.05 ± 0.02 |
| 8 | 1.350 ± 0.123 | 5.35 ± 0.02 |
| 10 | 1.321 ± 0.116 | 5.70 ± 0.00 |
| 12 | 1.264 ± 0.120 | 6.10 ± 0.00 |
| 15 | 1.149 ± 0.095 | 6.42 ± 0.07 |
| 20 | 0.946 ± 0.101 | 6.40 ± 0.06 |
| 25 | 0.969 ± 0.152 | 6.50 ± 0.07 |
| 30 | 1.017 ± 0.162 | 6.43 ± 0.12 |
Furthermore, Table 2 shows that (OD600nm)48h increased when NaCl rose from 0% to 2% and was approximately the same for NaCl 0% and 4% and had a declining rate with increasing salinity from 4% to higher concentrations. Moreover, pH48h decreased from 4.9 to 4.6 where NaCl increased from 0% to 2%. It was the same for NaCl 0% and 4% and had an increasing rate along with increasing NaCl to concentrations higher than 4%.
Effect of pH on growth
Figure 3 indicates that the slope of the growth curve in the logarithmic phase and maximum OD-based biomass in the stationary phase were approximately the same, while the initial pH was adjusted from 5 to 11. At pH 3 and 4, growth rate of GT7 and maximum OD declined and once pH was adjusted to 12, bacterial growth was not considerable.
Figure 3: Effect of different initial pH values of medium on growth of K. quasipneumoniae GT7 in YS medium under static conditions at 30°C
Viable cell measurements (Table 3) revealed that during 5 h of incubation, bacterial count increased to some extent when the initial pH was 5-11. Furthermore, bacteria maintained their survival to a large extent during 48 h when the initial pH was 3-11. However, a pH of 12 led to a great loss of viable cells.
Effect of pH on dye removal
Figure 4 reveals a slight hydrolysis of Carmoisine in acidic or alkaline mediums; approximately ≃7 mg/l, ≃4mg/l, and ≃9mg/l Carmoisine were removed in control experiments after 48 h of incubation with the initial pHs < 6, pH = 6, and pHs > 6, respectively. The dye spots appearing on TLC sheet (Figure A4) confirmed the presence of Carmoisine in all samples of the control experiments regardless of pH.
Table 3: Viable cells of K. quasipneumoniae GT7 grown statically in YS medium with various initial pH levels, after 5 h and 48 h of incubation at 30°C, where inoculated cells were 130 × 107 CFU/ml
| Initial pH | CFU/ml | |
| 5 h | 48 h | |
| 3 | (105 ± 1.6) × 106 | (52 ± 0.8) × 106 |
| 4 | (111 ±1.7) × 106 | (81 ± 1.2) × 106 |
| 5 | (289 ± 4.3) × 106 | (96 ± 1.4) × 106 |
| 6 | (274 ± 4.1) × 107 | (117 ± 1.8) × 106 |
| 7 | (229 ± 3.4) × 107 | (120 ± 1.8) × 106 |
| 9 | (281 ± 4.2) × 107 | (133 ± 2) × 106 |
| 11 | (270 ± 4.1) × 107 | (139± 2.1) × 106 |
| 12 | (89 ± 1.3) × 106 | (40 ± 0.6) × 103 |
Figure 4: Effect of different initial pH values on dye removal from YS+C,50ppm medium, (a) inoculated with K. quasipneumoniae GT7 and (b) non-inoculated (control) experiments during static incubation at 30°C
Figure 4 shows that in the early hours of inoculation, no biological manifestation was detected and consequently no significant difference was observed between dye concentrations in inoculated and corresponding control samples. Furthermore, Figures 4 and 5 indicate that once the initial pH was in the range of 5-11, along with the logarithmic growth of bacteria, Carmoisine was removed. A significant dye reduction between ≃30 - ≃40 mg/l was observed when the highest growth occurred during 20 h. The upper range corresponded to pH 11 wherein the highest growth of GT7 strain was detected (Figure 3). After 48 h of incubation, almost all of the initial Carmoisine in the inoculated bottles with initial pH 5-11 was removed (Figure 4) by degradation into aromatic amines appearing as fluorescent spots in TLC analysis (Figure A4). Table 4 shows that bacteria growth under pH 5-11 was manifested by increased (OD600nm)48h and decreased pH48h due to acidic metabolites of cellular metabolism.
Table 4: OD600nm and pH measurements for YS+C,50ppm after 48h of inoculation with K. quasipneumoniae GT7 incubated under various adjusted initial pH levels, where initial OD600nm was ≃0.65
Table 4: OD600nm and pH measurements for YS+C,50ppm after 48h of inoculation with K. quasipneumoniae GT7 incubated under various adjusted initial pH levels, where initial OD600nm was ≃0.65
| Initial pH | (OD600nm)48h | pH48h |
| 3 | 1.333 ± 0.157 | 3.15 ± 0.01 |
| 4 | 1.424 ± 0.109 | 4.14 ± 0.01 |
| 5 | 1.426 ± 0.107 | 4.85 ± 0.01 |
| 6 | 1.430 ± 0.113 | 4.80 ± 0.01 |
| 7 | 1.431 ± 0.112 | 4.87 ± 0.01 |
| 9 | 1.452 ± 0.118 | 4.87 ± 0.01 |
| 11 | 1.481 ± 0.106 | 5.14 ± 0.02 |
| 12 | 0.440 ± 0.028 | 11.90 ± 0.01 |
Figure 4 indicates that GT7 cells incubated in YS+C,50ppm under intense acidic stress of pH 3, removed dye (≃23 mg/l) after 5 h of incubation, attaining ≃27 mg/l after 48 h. It should be noted that only ≃7 mg/l of Carmoisine was removed during 48 h in the corresponding control experiment (Figure 4). However, TLC analysis revealed dye spots for both inoculated and non-inoculated samples after 48 h of incubation (Figure A4). Moreover, Figure A5 shows dye adsorption on the cell surface of bacteria during the incubation in YS+C,50ppm under initial pH 3.
Once pH was adjusted to 4, during 48 h of incubation, ≃38 mg/l of the dye was removed (Figure 4) and fluorescent spots of aromatic amines appeared on TLC (Figure A4). It is noteworthy that after 96 h of incubation, Carmoisine was completely removed from YS+C,50ppm medium incubated under initial pH 4 and no adsorbed dye remained on the cell pellets (data not shown). Table 4 reveals that although (OD600nm)48h increased under initial pH 3 and pH 4, indicating that the growth of cells leads to the release of acidic metabolites into the medium, the pH of the medium not only did not decrease but also slightly increased.
In addition, Figure 4 represents that once the initial pH was adjusted to 12, after 20 h of incubation; ≃24 mg/l of dye was removed, reaching ≃31mg/l during 48 h. This is while the maximum dye removal was ≃9mg/l for corresponding control experiments during 48 h. On the other hand, cell viability decreased four logarithmic units after 48 h of incubation under pH 12 (Table 3).(OD600nm)48h and pH measurements given in Table 4 show no growth and negligible pH fluctuations during incubation of GT7 in YS+C,50ppm medium under pH 12.
Scanning electron microscopy
Figure 5 shows the morphology of bacteria collected from different culture media, including bacteria grown in YTS for 21 h, bacteria grown in YS+C,50ppm containing NaCl (0%, 15% and 30%) during 5h of incubation, as well as bacteria cultivated in YS+C,50ppm with pH 3, 7, and 12, grown for 5 h. SEM (Figure 5) indicated that both salinity and pH stresses gave rise to the morphological transition in K. quasipneumoniae GT7 cells from rod- to coccoid-shaped.
Figure 5: Scanning electron micrographs (magnification 5000X) of K. quasipneumoniae GT7 (a) grown in YTS for 21 h at 30°C and 180 rpm and grown during static incubation in YS+C,50ppm medium for 5 h under conditions of (b) pH = 7.1, NaCl 0%, (c) pH = 7.1, NaCl 15%, (d) pH = 7.1, NaCl 30%, (e) pH = 3, NaCl 0%, (f) pH = 11, NaCl 0%, and (g) pH = 12, NaCl 0%
Discussion
Since most colored effluents contain salt and its concentration is often high, for example 15-20% in dyeing and printing wastewaters 7, isolation and identification of halotolerant and halophilic microorganisms capable of degrading dyes is of great importance. K. quasipneumoniae GT7 proved efficient in the degradation of azo dye in the authors’ previous study 15 and was studied in the presence of NaCl within the 0-30% range. The highest growth was obtained at 2% NaCl, similar to what was reported by Linke et al. regarding a salt-tolerant pleomorphic Klebsiella strain isolated from a case of diabetic periodontitis 19. The salt tolerance of K. quasipneumoniae GT7 was also comparable or even greater than the results reported for Shewanella marisflavi EP1 by Xu et al. 14. The halotolerance of bacteria may be attributed to osmotic balance of the cytoplasm with the milieu salinity provided by different strategies 8–11. The results of viability measurements consistent with OD600nm indicated that the best bacterial growth occurred in the presence of 2% NaCl while bacterial survival was largely maintained up to 15% salinity. Therefore, it is expected that bacteria would be able to maintain functionality in this range of salinity to an acceptable level.
Removal of Carmoisine dye by K. quasipneumoniae GT7 was investigated in YS+C,50ppm medium in the presence of various salinity levels. In fact, Carmoisine with two sulfonate groups is an anionic dye, which is negatively charged when dissolved in water 20–22. It is consequently exposed to coagulation by positive ions of NaCl due to electrostatic attraction and charge neutralization 23,24, resulting in dye removal from the medium. Furthermore, Figure 2 indicates that inoculation of GT7 into YS+C,50ppm increased dye removal in comparison to corresponding control experiments implying involvement of biological activity in dye removal. The results confirmed the biological transformation of Carmoisine by K. quasipneumoniae GT7 under NaCl 0-8%. Despite insignificant growth of bacteria (Figure 1) and a slight decline in viable cells (Table 1) in the presence of NaCl 10-12%, dye removal not only did not reduce but also accelerated at NaCl 12%. Furthermore, fluorescent spots on TLC appearing for samples of inoculated medium which included NaCl 10-12% (Figure A1) revealed biotransformation of Carmoisine by GT7 under NaCl 10-12%. To justify the observations, it is postulated that the NaCl at 10-12% upsets the cytoplasmic osmotic balance, but GT7 cells were able to prevent the complete destruction of the balance via different strategies 8–11. Consequently, a slight disruption in osmotic balance resulting in minor plasmolysis of bacterial cells 1,6,7 appeared as a decrease in bacterial growth (Figure 1) but maintained high viability (Table 1). Moreover, it can be hypothesized that Na+ ions surrounded the bacteria cells because of the negative charge on the cell surface due to the presence of peptidoglycan 25, and this Na+ layer assists attraction of anionic dye toward the cells (Figure A3.a). This facilitates electron transfer from cell to dye molecules to reduce them. In the absence of Na+, azo dyes, due to high polarity and high molecular weight, are not able to approach or penetrate through the cell membrane. Therefore electron shuttles are responsible for carrying the electrons produced in the respiration chain to azo dye 26,27. Coagulated dye became available to bacterial degradation through a bridge-like interaction mediated by Na+ ions due to high affinity of dye for Na+ (Figure A3.b). Therefore, no dye particle was detected in cell pellets harvested after 48 h of incubation (Figure A2), although salt coagulated dyes were precipitated in centrifugation of non-inoculated samples. Similar trends could be observed at higher NaCl concentrations. At NaCl concentrations higher than 15%, viable cells decreased 3 logarithmic units (Table 1); therefore, biological manifestations are decelerated in the medium.
The inoculated mediums under all saline conditions showed bacterial growth and metabolic activities, appearing as increased (OD600nm)48h and pH decline caused by cellular metabolism. This is while non-inoculated experiments showed consistent pH during the incubation period. Thus, under all NaCl concentrations, biological activity contributed to dye removal from YS+C,50ppm medium. Furthermore, at NaCl concentrations greater than 2%, by increasing salinity causing the loss of osmotic balance of the cytoplasm, bacterial growth rate displayed a negative slope resulting in reduced bacterial metabolism and consequently decreased acidic metabolites and increased pH48h. These parallel data of (OD600nm)48h and pH48h demonstrated that the presence of NaCl 2% was the most proper condition for GT7, leading to the highest growth of (OD600nm)48h and the highest cellular metabolism and, ultimately, to the lowest pH48h. This is consistent with observations of OD600nm during cultivation in YS mediums (Figure 1).
Discharged effluents are of different pH values, and also pH changes occur during the bioremediation process along with bacterial growth; therefore, evaluation of bacterial capacity for growth and survival in a wide range of pH levels is of great importance. The findings on the GT7 strain showed the most growth and the highest survival rate when the initial pH was adjusted to 11, which is a common alkaline condition of colored and saline wastewaters 28. Moreover, the perceived growth of K. quasipneumoniae GT7 under various pH conditions can be assigned to the fact that a number of bacterial strains are able to maintain their pH homeostasis using various mechanisms. In other words, some bacteria are able to maintain cytoplasmic pH within 7.4-7.8 against changes in milieu, so that optimal functional and structural integrity of the cytoplasmic proteins are maintained to support growth over a wide range of pH values 29–31. In addition, Carmoisine as an anionic dye is negatively charged when dissolved in water 20–22, and consequently interacts electrostatically with the charged species in the medium. Electrostatic interactions are affected by pH (H+ ion concentration) 32.
Slight hydrolysis of Carmoisine in acidic or alkaline mediums detected in control experiments is consistent with earlier studies reporting that azo dyes are resistant to acidic or alkaline hydrolysis 33. This confirms the involvement of biological activity in dye removal in the inoculated medium under all pH conditions. Under pH 3, biodegradation was not an important contributing factor in Carmoisine removal and most of the dye was likely removed through adsorption on the cell surface. In fact, pH-dependent ionization of cell surface groups, such as amino, carboxylate, and phosphate groups 25, reduces the negative charge of the cell surface 34, increasing its affinity to anionic Carmoisine dye, thus promoting dye adsorption (Figure A5). However, strategies assisting bacteria to resist the low pH 3 29 do not permit the release of the electrons and protons (H+) produced in the respiratory chain, inhibiting dye reduction. This is due to the intricate correlation between the proton motive force (PMF) and ATP, namely the link between cellular bioenergetics and the charge regulation effect, which occurs at the surface of the cell 35. An observation worth mentioning is that the adsorbed dye at pH 3 was not desorbed during the cell washing with water or normal saline (namely, an irreversible adsorption between dye and cells in aqueous medium) but dye was desorbed in ethanol during the dehydration step in the glutaraldehyde fixation procedure. This is due to the fact that the hydrogen bond between functional groups of dyes (N-H) and water (OH) is not strong enough to remove the dye from the cell surface. It is not similar to the hydrogen bond between functional groups of dyes (N-H) and ethanol (OH) which is strong enough to remove the dye from the cell surface. Once pH was adjusted to 4, GT7 cells not only adsorb the dye as observed at pH 3, but also have the ability to transfer the electrons of the respiratory chain to the dye for redox reaction. Therefore, the Carmoisine adsorbed on the cells (Figure A5) wasgradually reduced and degraded. Interestingly, the data in Table 4 indicates that although (OD600nm)48h increased under initial pH 3 and pH 4, which indicates the growth of cells leading to the release of acidic metabolites into the medium, the pH of the medium not only did not decrease but also slightly increased. This is due to the fact that acidic intermediates, such as pyruvic acid and propanoic acid have pH levels between ≃3.1 – 4. Moreover, under initial pH 4, aromatic amines from degradation of dye rendered alkaline characteristics in the medium.
The slight dye removal, decreased cell viability, no growth, and negligible pH fluctuations during incubation of GT7 in YS+C,50ppm medium under pH12, raise a hypothesis. It indicates that due to the large difference in pH between the inner side of the cytoplasmic membrane and the bulk phase (the outer side of membrane) under alkaline conditions of pH 12, the rate of H+ exchange across the cytoplasmic membrane becomes so high. Therefore, a proton-less condition occurs in cytoplasm, which is not tolerated by GT7 cells36. This result in bacterial cell death and lysis cells associated with loss of cell survival and activity. However, proton flow toward the bulk phase led to Carmoisine degradation, albeit incomplete, under initial pH 12. Consequently, inoculated samples under initial pH 12 displayed fluorescent spots of aromatic amines with the pale red color of Carmoisine on TLC (Figure A4). The pH measurements in Table 4 indicate that no significant variation of pH was detected during the decolourization process under pH 12. It might be due to the fact that a small amount of acidic metabolites from respiration metabolism of a few surviving cells under pH 12 confronted the alkalinity produced by aromatic amines from the degradation of dye.
SEM (Figure 5) indicated that both salinity and pH stresses gave rise to the morphological transition in K. quasipneumoniae GT7 cells from rod- to coccoid-shaped. Morphological alteration is a defensive strategy used by some gram-negative bacteria to resist extreme environmental conditions which is commonly accompanied by a VBNC (viable but nonculturable) state 37. It was previously reported that a variety of gram-negative bacteria in response to various environmental stresses enter into a state of VBNC. It is believed to be a survival strategy whereby bacteria maintain their viability under harsh environmental conditions, but are no longer able to be cultured in or on routine mediums. These harsh conditions include starvation, heat shock, hyperosmolarity, extreme pH, inappropriate aeration, light exposure, and etc. Bacteria may be resuscitated from a VBNC state when the stress is eliminated 38,39. Klebsiella aerogenes, Klebsiella pneumoniae, and Klebsiella planticola are among the bacteria known to enter the VBNC state under environmental stress conditions 38,39. Tables 1 and 3 show that the viability of GT7 was maintained to a large extent under extreme conditions of salinity and pH while growth was inhibited (Figures 1 and 4). Slight increases in OD600nm under salinity higher than 10% (Figure 1 and Table 2) and/or under initial pH 3, 4 (Figure 3 and Table 4) may be related to their morphological transition from rod- to coccoid-shaped. This morphological alteration increases surface-to-volume ratio which is beneficial for nutrient uptake to supply the energy requirement for survival during starvation 37,40 or other harsh conditions. Furthermore, coccoid morphology provides increased surface area for electrostatic interaction between cells and dye molecules in extreme conditions of hyper-salinity and harsh pH levels. Accelerated decolourization was detected for 10% ≤ [NaCl] ≤ 15%, pH 3 and pH 11, respectively, during 20 h (Figure 2), 5 h (Figure 4) and 20 h (Figure 4) of incubation. It should be further explained that within a state of VBNC, bacteria remain physiologically active and render respiratory chain activity 41, consequently producing electrons and protons (H+) necessary to reduce azo bond. Therefore, coccoid-shaped GT7 in the VBNC state can maintain a respiratory chain and not only contribute to biological dye reduction, but also accelerate decolourization under 10% ≤ [NaCl] ≤ 15%, pH 3 and pH11 due to increased surface-to-volume of cells.
Conclusion
Klebsiella quasipneumoniae GT7 demonstrated capability to degrade azo dye Carmoisine under extreme conditions. GT7 displayed growth and sustainable viability under [NaCl] ≤ 15% and/or initial pH between 3-11, while the highest growth was achieved at 2% NaCl and/or initial pH 11. Growth was attenuated out of this range of salinity or pH due to inefficiency of the bacteria to maintain cytoplasmic osmotic balance, vital turgor pressure, and pH homeostasis. But considerable viability of GT7 cells was demonstrated in the VBNC state where bacteria showed insignificant growth. Dye removal by GT7 cells was accomplished during 48 h, where [NaCl] ≤ 20% and/or initial pH were 5-11. Degradation was the primary mechanism of dye removal by GT7 cells; however, dye adsorption was dominant at pH 3. Morphological alteration from rod- to coccoid-shaped was demonstrated as a defensive strategy for GT7 in resisting the harsh environmental conditions. The results of this study reveal that K. quasipneumoniae GT7 can be employed as an efficacious strain in the biological treatment of colored effluents.
Acknowledgements
The authors wish to gratefully acknowledge the financial support provided by the National Institute of Genetic Engineering and Biotechnology.
Funding
National Institute of Genetic Engineering and Biotechnology (Grant No. 980720-I-733).
Conflicts of interest
The authors declare there is no conflict of interest.
This is an Open-Access article distributed in accordance with the terms of the Creative Commons Attribution (CC BY 4.0) license, which permits others to distribute, remix, adapt, and build upon this work for commercial use.
References
1. Guo J, Zhou J, Wang D, et al. A novel moderately halophilic bacterium for decolorizing azo dye under high salt condition. Biodegradation. 2008;19:15–9.
2. Guadie A, Gessesse A, Xia S. Halomonas sp. strain A55, a novel dye decolorizing bacterium from dye-uncontaminated Rift Valley Soda lake. Chemosphere. 2018;206:59–69.
3. Guo G, Li X, Tian F, et al. Azo dye decolorization by a halotolerant consortium under microaerophilic conditions. Chemosphere. 2020;244:125510.
4. Guo G, Liu C, Hao J, et al. Development and characterization of a halo-thermophilic bacterial consortium for decolorization of azo dye. Chemosphere. 2021;272:129916.
5. Zhuang M, Sanganyado E, Zhang X, et al. Azo dye degrading bacteria tolerant to extreme conditions inhabit nearshore ecosystems: Optimization and degradation pathways. J Environ Manage. 2020;261:110222.
6. Cao J, Sanganyado E, Liu W, et al. Decolorization and detoxification of Direct Blue 2B by indigenous bacterial consortium. J Environ Manage. 2019;242:229–37.
7. Zhou J, Xu Y, Qu Y, et al. Decolorization of Brilliant Scarlet GR enhanced by bioaugmentation and redox mediators under high-salt conditions. Bioresour Technol. 2010;101:586–91.
8. Bremer E. Coping with osmotic challenges: osmoregulation through accumulation and release of compatible solutes in B. subtilis. Comp Biochem Physiol A. 2000;126:17.
9. Chen YH, Lu CW, Shyu YT, et al. Revealing the Saline Adaptation Strategies of the Halophilic Bacterium Halomonas beimenensis through High-throughput Omics and Transposon Mutagenesis Approaches. Sci Rep. 2017;7:13037.
10. Gunde-Cimerman N, Plemenitaš A, Oren A. Strategies of adaptation of microorganisms of the three domains of life to high salt concentrations. FEMS Microbiol Rev. 2018;42:353–75.
11. Imhoff JF. Survival strategies of microorganisms in extreme saline environments. Adv Space Res. 1986;6:299–306.
12. Asad S, Amoozegar MA, Pourbabaee AA, et al. Decolorization of textile azo dyes by newly isolated halophilic and halotolerant bacteria. Bioresour Technol. 2007;98:2082–8.
13. Khalid A, Arshad M, Crowley DE. Decolorization of azo dyes by Shewanella sp. under saline conditions. Appl Microbiol Biotechnol. 2008;79:1053–9.
14. Xu F, Mou Z, Geng J, et al. Azo dye decolorization by a halotolerant exoelectrogenic decolorizer isolated from marine sediment. Chemosphere. 2016;158:30–6.
15. Poorasadollah D, Bagheri Lotfabad T, Heydarinasab A, et al. Biological activated carbon process for biotransformation of azo dye Carmoisine by Klebsiella spp. Environ Technol. 2021;1–17.
16. Harrigan WF, McCance ME (eds). Laboratory Methods in Microbiology. 1st ed. Academic Press. Epub ahead of print 1 January 1966. DOI: 10.1016/B978-1-4832-3205-8.50001-5.
17. Kiayi Z, Lotfabad TB, Heidarinasab A, et al. Microbial degradation of azo dye carmoisine in aqueous medium using Saccharomyces cerevisiae ATCC 9763. J Hazard Mater. 2019;373:608–19.
18. Vatandoostarani S, Lotfabad TB, Heidarinasab A, et al. Integrated system of multiple batches to evaluate the continuous performance of microbial cells in decolourization processes. J Environ Chem Eng. 2018;6:728–35.
19. Linke HA, Sánchez-Cordero S, Hoffman H. Isolation of a salt tolerant pleomorphic Klebsiella strain from a case of diabetic periodontitis. Microbios. 1980;27:107–15.
20. Datta S, Mahapatra N, Halder M. pH-insensitive electrostatic interaction of carmoisine with two serum proteins: A possible caution on its uses in food and pharmaceutical industry. J Photochem Photobiol B. 2013;124:50–62.
21. Nazar MF, Murtaza S, Ijaz B, et al. Photophysical Investigations of Carmoisine Interacting with Conventional Cationic Surfactants Under Different pH Conditions. J Dispersion Sci Technol. 2015;36:18–27.
22. Sadeghi A, Ehrampoush MH, Taghi Ghaneian, M, et al. The effect of diazinon on the removal of carmoisine by Saccharomyces cerevisiae. Desalin Water Treat. 2019;137:273–8.
23. Guibal E, Roussy J. Coagulation and flocculation of dye-containing solutions using a biopolymer (Chitosan). React Funct Polym. 2007;67:33–42.
24. Lou T, Cui G, Xun J, et al. Synthesis of a terpolymer based on chitosan and lignin as an effective flocculant for dye removal. Colloids Surf A Physicochem Eng Asp. 2018;537:149–54.
25. Chandraprabha MN, Natarajan KA. Microbially Induced Mineral Beneficiation. Miner Process Extr Metall Rev. 2009;31:1–29.
26. Chen X, Xu M, Wei J, et al. Two different electron transfer pathways may involve in azoreduction in Shewanella decolorationis S12. Appl Microbiol Biotechnol. 2010;86:743–51.
27. Pandey A, Singh P, Iyengar L. Bacterial decolorization and degradation of azo dyes. Int Biodeterior Biodegradation. 2007;59:73–84.
28. Ogugbue CJ, Sawidis T, Oranusi NA. Evaluation of colour removal in synthetic saline wastewater containing azo dyes using an immobilized halotolerant cell system. Ecol Eng. 2011;37:2056–60.
29. Guan N, Liu L. Microbial response to acid stress: mechanisms and applications. Appl Microbiol Biotechnol. 2020;104:51–65.
30. Nyanga-Koumou AP, Ouoba LII, Kobawila SC, et al. Response mechanisms of lactic acid bacteria to alkaline environments: A review. Crit Rev Microbiol. 2012;38:185–90.
31. Padan E, Bibi E, Ito M, et al. Alkaline pH homeostasis in bacteria: New insights. Biochim Biophys Acta Biomembr. 2005;1717:67–88.
32. Rajan R, Ahmed S, Sharma N, et al. Review of the current state of protein aggregation inhibition from a materials chemistry perspective: special focus on polymeric materials. Mater Adv. 2021;2:1139–76.
33. Benkhaya S, M’rabet S, El Harfi A. Classifications, properties, recent synthesis and applications of azo dyes. Heliyon. 2020;6:e03271.
34. Shingaki R, Gorlach K, Hattori T, et al. The cell surface charge of fast-and slow-growing bacteria isolated from a paddy soil. J Gen Appl Microbiol. 1994;40:469–75.
35. Hong Y, Brown DG. Variation in Bacterial ATP Level and Proton Motive Force Due to Adhesion to a Solid Surface. Appl Environ Microbiol. 2009;75:2346–53.
36. Matsuno T, Goto T, Ogami S, et al. Formation of Proton Motive Force Under Low-Aeration Alkaline Conditions in Alkaliphilic Bacteria. Front Microbiol. 2018;9:2331.
37. Ultee E, Ramijan K, Dame RT, et al. Stress-induced adaptive morphogenesis in bacteria. Adv Microb Physiol. 2019;74:97–141.
38. Oliver JD. Recent findings on the viable but nonculturable state in pathogenic bacteria. FEMS Microbiol Rev. 2010;34:415–25.
39. Oliver JD. The viable but non-culturable state in the human pathogen Vibrio vulnificus. FEMS Microbiol Lett. 1995;133:203–8.
40. Taweechaisupapong S, Kamjumphol W, Chareonsudjai S, et al. Morphological Alteration and Survival of Burkholderia pseudomallei in Soil Microcosms. Am J Trop Med Hyg. 2015;93:1058–65.
41. Zhang J, Wang L, Shi L, et al. Survival strategy of Cronobacter sakazakii against ampicillin pressure: Induction of the viable but nonculturable state. Int J Food Microbiol. 2020;334:108819.
Appendix
Figure A1: Display of TLC sheet samples extracted fromYS+C,50ppm medium under various NaCl concentrations (0, 2%, 4%, 6%, 8%, 10%, 12%, 15%, 20%, 25% and 30%), (a & a′) inoculated with K. quasipneumoniae GT7 and (b & b′) not inoculated (control experiments) and statically incubated at 30°C for 48 h. Sheets were visualized under visible (a & b) and UV (a′ & b′) lights. The letter ″C″ on sheets stands for extract from YS+C,50ppm medium at the time of zero.
Figure A2: Cell pellets collected from inoculated YS+C,50ppm medium including NaCl at different concentrations (0-30%) after 48 h of inoculation with K. quasipneumoniae GT7 and static incubation at 30°C.
Figure A3: Arrangement of Na+ ions and dye molecules surrounding cells of K. quasipneumoniae GT7, inYS+C,50ppm medium including NaCl, where, dye is (a) in dissolved form and (b) in salted out form with NaCl.
Figure A4: Display of TLC sheet samples extracted fromYS+C,50ppm medium with pH adjusted to different values (3, 4, 5, 6, 7, 9, 11, and 12), (a & a′) inoculated with K. quasipneumoniae GT7 and (b & b′) not inoculated (control experiments) and statically incubated at 30°C for 48 h. Sheets were visualized under visible (a & b) and UV (a′ & b′) lights. The letter ″C″ on sheets stands for extract from YS+C,50ppm medium at the time of zero.
Figure A5: Cell pellets collected from inoculated YS+C,50ppm medium with initial pH adjusted to (a) 3, (b) 4, (c) 5-11 and (d) 12 after 48 h of inoculation with K. quasipneumoniae GT7 and static incubation at 30°C.
Type of Study: Original articles |
Subject:
Environmental pollution
Received: 2022/02/11 | Accepted: 2022/04/20 | Published: 2022/06/20
Received: 2022/02/11 | Accepted: 2022/04/20 | Published: 2022/06/20
Send email to the article author
| Rights and permissions | |
 |
This work is licensed under a Creative Commons Attribution-NonCommercial 4.0 International License. |
