

Volume 5, Issue 3 (September 2020)
J Environ Health Sustain Dev 2020, 5(3): 1063-1076 |
Back to browse issues page


Download citation:
BibTeX | RIS | EndNote | Medlars | ProCite | Reference Manager | RefWorks
Send citation to:


BibTeX | RIS | EndNote | Medlars | ProCite | Reference Manager | RefWorks
Send citation to:
Jafari N, Ebrahimi A, Ebrahimpour K, Abdolahnejad A. Optimization and Modeling of Microcystin-LR Degradation by TiO2 Photocatalyst Using Response Surface Methodology. J Environ Health Sustain Dev 2020; 5 (3) :1063-1076
URL: http://jehsd.ssu.ac.ir/article-1-261-en.html
URL: http://jehsd.ssu.ac.ir/article-1-261-en.html


Department of Public Health, Maragheh University of Medical Sciences, Maragheh, Iran.
Full-Text [PDF 1169 kb]
(693 Downloads)
| Abstract (HTML) (1997 Views)
.png)
Figure 1: The molecular structure of MC-LR
Ethical issues
This study was conducted with approval of Isfahan University of Medical Sciences. Research Ethics Code was IR.MUI.REC.1395.3.847.
Results
Characterization study
The TiO2 photocatalysts w:as char:acterized by FESEM, FTIR, and XRD (Figure 2). These TiO2 particles have asymmetrical and angular shapes (Figure 2a). Figure 2b shows the FTIR spectra of TiO2 nanoparticles. In the FTIR spectra of TiO2, the wavelength of 3408 cm−1 was associated with the Hydroxide bonds (O-H), indicating the presence of water and moisture molecules. Furthermore, the wavenumber 455 cm−1 was related to the metal hydroxides bonds 40, 41. The spectrum of XRD related to the TiO2 is demonstrated in Figure 2c. According to the
XRD patterns, the index peaks of synthetic TiO2 located at about 2θ = 25.33°, 37.8°, 30.57°, 48.1°, and 53.9° correspond well to the anatase phase of TiO2 43-45.
.png)
Figure 2: SEM (a), FTIR (b), and XRD (c) geraphs of TiO2 catalyst
Table 4: The results of analysis of variance in removing MC-LR
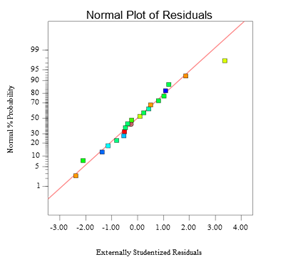
The correlation between actual, predicted, and normal graphs of the residuals in removing MC-LR are presented in Figures 3a and b. According to these figures, data distribution shows a straight line, which indicates that the experimental data are fitted by the response predicted values.

Discussion
Effect of variables on photocatalytic degradation of MC-LR
Effect of single factors
Among the pH, contact time, and catalyst dose variables, factors with high mean square and high F-value had the highest effect on the photodegradation of MC-LR by TiO2. So, Catalyst dose (c) with mean square = 703.3 and F-value = 360.3 were the most important parameters in MC-LR removal. Moreover, the pH and contact time variables had lower importance than catalyst dose in MC-LR degradation.
Effect of pH
The effect of pH on the removal of MC-LR at various ranges of pH is presented in Figure 4a. This figure shows that the pH variable has a negative effect on MC-LR removal. So, the degradation rate of MC-LR increased with decrease of the pH. Therefore, the results indicated that MC-LR removal had increased in the acidic range. Generally, in photocatalytic systems, the acidic range was determined considering the strong electrostatic adsorption between the positive charges of catalyst and the negative charges of toxin were determined as the optimal pH in photocatalytic degradation of toxins. So, the forces between the catalyst particles and MC-LR molecules were attractive forces resulting in high photodegradation 42. Samy et al. reported that the photocatalytic degradation of chlorpyrifos was increased in the acidic pH due to the effect of attractive forces between the catalyst particles and chlorpyrifos molecules 46. In addition, other similar studies showed that the removal efficiency of direct red 16 (DR16), methylene blue, and Acid Blue 113 dyes was decreased in alkaline pH. In acidic pH, photocatalytic activity was improved by electrostatic force interactions between dye molecules and surface of the catalyst 47-49. Fakhravar et al. reported that the degradation rate of Metronidazole increased with decrease of the initial pH 50.
Effect of irradiation time
Figure 4b demonstrates the effect of contact times on the removal efficiency of MC-LR using TiO2 photocatalysts. The results indicated a positive relationship between contact time and MC-LR degradation. In other words, increase of the contact time enhances the MC-LR removal efficiency because increase of the contact time enhances the reaction time, and increases probability of the interaction between MC-LR and electron-hole pair subsequently. Rahimi et al. showed that degradation rate of acid orange 10 increased by increase of the contact time. In other words, when the contact time increased from the start of the process to 150 min, the removal efficiency reached from 0 to 94% 41. Similar studies by Sheikh Asadi et al. and Rafiee et al. reported that enhancing the contact time increased the removal efficiency of Bisphenol A and DR16 dye, respectively. This is due to the fact that increased contact time enhanced the photocatalytic activities in the catalyst surface 51, 52.
Effect of catalyst dose
The effect of the TiO2 catalyst dose on the removal efficiency of MC-LR is represented in Figure 4c. This figure shows that the degradation rate of MC-LR increases with increasing TiO2 catalyst dose because the active sites of catalysts rise and cause absorption of MC-LR and light, which increase the photocatalytic degradation consequently. Zhang et al. reported that degradation rate of the MC-LR enhanced with the increase of catalyst dose due to the surface area of the catalyst 53. Koh et al. and Arabzadeh et al. reported that the photodegradation rate of Methylene Blue (MB) and tartrazine enhanced when the catalyst dose increased, respectively. Increase of the catalyst dose can enhance the photocatalytic active sites to absorb more photons. This generates more hydroxyl and superoxide radicals and finally degrades more pollutant molecules 54, 55. Therefore, given the cost and effects of the catalyst, choosing the optimum catalyst dose is very indispensable.
.png)
.png)

Figure 4: The effect of pH (a), contact time (b) and catalyst dose (c) on MC-LR degradation (%)
.png)
Figure 5: Interaction between different variables: (a) Contact time vs. pH; (b) Catalyst dose vs. pH; (c) Catalyst dose vs. Contact time in the MC-LR degradation (%)
.png)
Figure 6: Degradation mechanism of MC-LR.
Full-Text: (781 Views)
Optimization and Modeling of Microcystin-LR Degradation by TiO2 Photocatalyst Using Response Surface Methodology
Negar Jafari 1, Afshin Ebrahimi 1, Karim Ebrahimpour 1, Ali Abdolahnejad 2*
1 Environment Research Center, Research Institute for Primordial Prevention of Non-Communicable Disease, Isfahan University of Medical Sciences, Isfahan, Iran and Department of Environmental Health Engineering, School of Health, Isfahan University of Medical Sciences, Isfahan, Iran.
2 Department of Public Health, Maragheh University of Medical Sciences, Maragheh, Iran.
| A R T I C L E I N F O | ABSTRACT | |
| ORIGINAL ARTICLE | Introduction: Microcystin-leucine arginine (MC-LR) is a toxin with harmful effects on the liver, kidney, heart, and gastrointestinal tract. So, effective removal of MC-LR from water resources is of great importance. The aim of this study was to remove microcystin-LR (MC-LR) from aqueous solution by Titanium Dioxide (TiO2). Materials and Methods: In the present study, TiO2, as a semiconductor, was used for photodegradation of MC-LR under ultraviolet light (UV). The Response Surface Methodology was applied to investigate the effects of operating variables such as pH (A), contact time (B), and catalyst dose (B) on the removal of MC-LR. The MC-LR concentration was measured by high-performance liquid chromatography (HPLC). Results: The results showed that single variables such as A, B, and C had significant effects on MC-LR removal (pvalue < 0.05). In other words, increase of the contact time and catalyst dose had a positive effect on enhancing the removal efficiency of MC-LR, but the effect of pH was negative. The analysis of variance showed that BC, A2, and C2 variables had a significant effect on the MC-LR removal (pvalue < 0.05). Finally, the maximum removal efficiency of MC-LR was 95.1%, which occurred at pH = 5, contact time = 30 minutes, and catalyst dose = 1 g/l. Conclusion: According to the findings, TiO2, as a photocatalyst, had an appropriate effect on degradation of the MC-LR. |
|
| Article History: Received: 21 May 2020 Accepted: 10 July 2020 |
||
| *Corresponding Author: Ali Abdolahnejad Email: abdolahnejad.a@gmail.com Tel: +989129307844 |
||
| Keywords: Microcystin-LR, TiO2, Photocatalytic Degradation, Response Surface Methodology. |
Citation: Jafari N, Ebrahimi A, Ebrahimpour K, et al. Optimization and Modeling of Microcystin-LR Degradation by TiO2 Photocatalyst Using Response Surface Methodology. J Environ Health Sustain Dev. 2020; 5(3): 1063-76.
Introduction
Algal blooms and cyanobacteria species can cause many problems for drinking water resources by generating cyanotoxins1, 2. Presence of cyanobacterial, as biological pollution, in freshwater environments has adverse effects on the water quality including its taste, odor, color, and even microbial diversity 3, 4. Discharge of nutrients, such as Nitrogen and Phosphorus, from agricultural watersheds to the freshwater resources is a major cause of cyanobacterial propagation 5, 6. Popular algal bloom-forming species include Aphanizomenon, Cylindrospermopsis, Dolichospermum, Microcystis, Nodularia, and Planktothrix and Trichodesmium 7. Toxins of cyanobacteria include hepatotoxins, neurotoxins, cytotoxins, dermatotoxins, and gastrointestinal toxins that threaten the human and the environment health 8-11. Among 80 variants of the cyanotoxin family, microcystins (MCs) are the most well-known 12, 13. Furthermore, microcystin-LR (MC-LR) is one of the most toxic members of the microcystins group 10, 14. Microcystin-LR is hepatotoxic; acute and chronic exposure to MC-LR can lead to liver cancer in humans and have harmful effects on the kidney, heart, and gastrointestinal tract 15-17. The World Health Organization (WHO) recommended the permissible level of 1 μg/L of MC-LR in the drinking water18, 19. So, the removal of MC-LR from drinking water resources is very necessary for human health and environmental safety 10. Many treatment methods, such as coagulation, flocculation, activated carbon adsorption, rapid sand filtration, and membrane separation were used for removing MC-LR from water body 14, 18, 20.In this regard, the traditional water treatment systems can remove cyanobacterial cells, but
they have limited capability in removing cyanotoxins due to different practical, economic, or environmental disadvantages 21, 22. The traditional treatment process can also release cyanotoxins into the water by ripping the cyanobacterial cells, , which increases the risk of secondary pollution 23. In the past decade, the Advanced Oxidation Process (AOPs), such as photocatalytic oxidation process, have received significant attention due to their effectiveness in degradation and mineralization of the resistant compounds such as cyanotoxins 24, 25. Various studies used the photocatalytic oxidation process to remove the environmental pollutants. For example, ZnO, UV–H2O2 and bismuth vanadate (BiVO4) is used for removal of microcystin-LR, Cyanobacterial taste and bisphenol A, respectively 6, 26-28. The effect of TiO2 was studied for degrading various pollutants, such as Azo dye, phenol, humic acid, nodularin, and cyanotoxin. The results showed that TiO2 had high efficiency in the removal of these pollutants 29-32. The photocatalytic oxidation process is a green technology that mineralizes the organic molecules into CO2 and inorganic ions by th producing strong reactive oxidizing species like hydroxyl radicals (OH•), superoxide anion radical (O2−•), and hydroperoxyl radical (HO2•) 18, 37, 38. Among the photocatalytic oxidation technologies (POTs), Titanium dioxide (TiO2) is a highly effective semiconductor material able to decompose water contaminations effectively; TiO2 has favorable properties such as high chemical and thermal stabilities, nontoxicity, commercial availability, and low cost 35. Usually, TiO2 can generate photo-excited electron-hole pairs by absorbing ultraviolet light. Later, the photo-excited electron-hole pairs reduce and oxidize the reactants adsorbed on the semiconductor surface. So, the reduction and oxidation reactions are the major mechanisms in water photocatalytic purification 32, 33. So, the aim of this study was to find the optimum condition for the TiO2 photocatalyst in removing MC-LR under UV light using Response Surface Methodology (RSM) based on the Central Composite Design (CCD).
Materials and methods
Materials
Microcystin-LR (MC-LR) (Molecular Formula: C49H74N10O12 , Molecular Weight: 995.2 g/mol) was considered as the standard solution (10 μg/ml) purchased from Sigma-Aldrich (Figure 1). Furthermore, TiO2 nanopowder (≥ 99% anatas) was prepared from Sigma-Aldrich Co. (USA). The standard solutions were prepared by dissolving standard powder of MC-LR in 1 ml of methanol (100%) and diluted with distilled water (Merck co, Germany). All solutions were stored at 4 °C until use 14. The other chemical materials such as methanol, acetonitrile, trifluoroacetic acid
(TFA) (HPLC-grade), sodium hydroxide, and Hydrochloric acid were purchased from Merck Company (Germany).
Figure 1: The molecular structure of MC-LR
All experiments were conducted with a mixture of catalysts; 10 ml of aquatic solutions were mixed with 500 μg/L MC-LR in 25 ml Pyrex beakers. For adjusting the pH of samples, NaOH (0.01M) and (0.01M) HCl were used. The aggregates were eliminated and then the samples were located in an ultrasonic bath (10 min). For photocatalyst suspensions, 100 W mercury lamp (wavelength of 254 nm) was placed 10 cm above the Pyrex beakers. Initially, the samples were stirred (30 min) in darkness to reach the balance. In addition, UV lamps were turned on and placed under magnetic stirring to keep the suspension uniformity. At the end of the required contact time, UV lamps were turned off and samples were taken. Before measuring the residual MC-LR content by HPLC, the samples were filtrated with syringe filters (0.22 μm) to separate the catalyst particles.
Characterization study
To investigate the structure and surface morphology of TiO2 nanoparticles, the field emission scanning electron microscope (FESEM) (FEI Quanta 200, USA) and X-ray diffractometer (XRD, Bruker D8 Advance, Germany) were used. Moreover, the FTIR spectrum of TiO2 was studied by an IR spectrometer (Jasco 6300, Japan).
Design of experiments
In this study, RSM was used to optimize the number of experiments and to evaluate the interactive effects of the significant operating parameters in the MC-LR degradation by TiO2 photocatalysts using the Design-Expert software 10 38-41. According to the Central Composite Design (CCD), as the most widely used method in evaluating interactive effects of the operating parameters, three variables of pH (A), contact time (B), and catalyst dose (C) were selected as the model variables (Table 1).
Table 1: Actual and coded values of the independent variables using CCD
| Variables | Unit | Actual values of the coded values | ||||
| -2 | -1 | 0 | +1 | +2 | ||
| pH (A) | 4 | 5 | 7 | 9 | 10 | |
| Contact time (B) | min | 5 | 10 | 20 | 30 | 35 |
| Catalyst dose (C) | g/l | 0.2 | 0.4 | 0.7 | 1 | 1.2 |
The coded values of independent variables were determined using Eq. (1):
 (1)
(1)
Where, Xi is a coded value of the independent variable, X0 is the center point value, and ΔX is the change value 40. To study the interaction among
the independent and dependent variables, the regression model was used (Eq. (2)):
Y = β0 + ∑ βiXi+ ∑ βiiXi2+ ∑ βijXiXj (2)
Where, Y is the predicted response of the MC-LR removal, β0 is the model constant, βi is the linear coefficient, βii is the quadratic coefficient, and the βij is the cross product coefficient.
Analysis and calculation
The concentration of MC-LR was quantified using an HPLC system (Jasco PU-2080, Tokyo, Japan) equipped with a quaternary mixing pump, an inline vacuum degasser, UV-Vis detector (UV-2075 plus), and an auto-injector (AS-2055 Plus). Samples were separated by the C18 column (150 × 4.6 mm, 5 μm particles). Combination of acetonitrile and Milli-Q water with a volume ratio of 50:50 plus 0.1% fluoroorotic acid (TFA) was used as the mobile phase with a flow rate of 1 ml/min. Due to the typical absorption spectra of MC-LR, the wavelength of UV detector was set at 238 nm 42. The injection volume was 100 μl with a flow rate of 1 ml/min and the total run time was 15 min. The Borwin Chromatography software (Version 1.50) was used for data acquisition and HPLC processing. MC-LR degradation rate was determined by (Eq. (3)):
Degradation rate (%) = C0 – C/C0 *100 (3)
Where, C0 and C are the initial and the residual concentrations of MC-LR, respectively.
For validating the analytical method, the relative recovery, limit of detection (LOD), and limit of quantification (LOQ) were calculated according to the recommendations set by the International Conference on Harmonization (ICH) (Table 2).
(1)Where, Xi is a coded value of the independent variable, X0 is the center point value, and ΔX is the change value 40. To study the interaction among
the independent and dependent variables, the regression model was used (Eq. (2)):
Y = β0 + ∑ βiXi+ ∑ βiiXi2+ ∑ βijXiXj (2)
Where, Y is the predicted response of the MC-LR removal, β0 is the model constant, βi is the linear coefficient, βii is the quadratic coefficient, and the βij is the cross product coefficient.
Analysis and calculation
The concentration of MC-LR was quantified using an HPLC system (Jasco PU-2080, Tokyo, Japan) equipped with a quaternary mixing pump, an inline vacuum degasser, UV-Vis detector (UV-2075 plus), and an auto-injector (AS-2055 Plus). Samples were separated by the C18 column (150 × 4.6 mm, 5 μm particles). Combination of acetonitrile and Milli-Q water with a volume ratio of 50:50 plus 0.1% fluoroorotic acid (TFA) was used as the mobile phase with a flow rate of 1 ml/min. Due to the typical absorption spectra of MC-LR, the wavelength of UV detector was set at 238 nm 42. The injection volume was 100 μl with a flow rate of 1 ml/min and the total run time was 15 min. The Borwin Chromatography software (Version 1.50) was used for data acquisition and HPLC processing. MC-LR degradation rate was determined by (Eq. (3)):
Degradation rate (%) = C0 – C/C0 *100 (3)
Where, C0 and C are the initial and the residual concentrations of MC-LR, respectively.
For validating the analytical method, the relative recovery, limit of detection (LOD), and limit of quantification (LOQ) were calculated according to the recommendations set by the International Conference on Harmonization (ICH) (Table 2).
Table 2: Analytical method validation parameters for determination of MC-LR by HPLC
| Parameter | Recovery (%) | LOD (μg/L) | LOQ (μg/L) |
| MC-LR | 102 ± 9.5 | 4.04 | 12.24 |
Ethical issues
This study was conducted with approval of Isfahan University of Medical Sciences. Research Ethics Code was IR.MUI.REC.1395.3.847.
Results
Characterization study
The TiO2 photocatalysts w:as char:acterized by FESEM, FTIR, and XRD (Figure 2). These TiO2 particles have asymmetrical and angular shapes (Figure 2a). Figure 2b shows the FTIR spectra of TiO2 nanoparticles. In the FTIR spectra of TiO2, the wavelength of 3408 cm−1 was associated with the Hydroxide bonds (O-H), indicating the presence of water and moisture molecules. Furthermore, the wavenumber 455 cm−1 was related to the metal hydroxides bonds 40, 41. The spectrum of XRD related to the TiO2 is demonstrated in Figure 2c. According to the
XRD patterns, the index peaks of synthetic TiO2 located at about 2θ = 25.33°, 37.8°, 30.57°, 48.1°, and 53.9° correspond well to the anatase phase of TiO2 43-45.
Figure 2: SEM (a), FTIR (b), and XRD (c) geraphs of TiO2 catalyst
Analysis of variance and model fitting
Eventually, 20 different experimental runs were designed by CCD, which are portrayed in Table 3 along with the predicted and actual MC-LR removal values. The results of analysis of variance for the removal of MC-LR are presented in Table 4. According to this table, F-value of the quadratic model was 80.78, indicating that the model was significant. If the “Prob > F” value of each parameter was less than 0.05, the effect of this parameter effect on MC-LR removal is significant. Therefore, single parameters of A, B, and C are significantly different. Except for AB, AC, and B2, the P-values related to the interactions of BC, A2, and C2 were less than 0.05 and indicated a significant effect on the MC-LR removal (p-value = 0.0410, 0.0001, and P = 0.0382, respectively). So, other quadratic forms did not have any significant effect on the model and could be removed from the final equation. The F-value lack of fit in this model was 3.23, showing that the lack of fit was not significant. In other words, the model fitted (p-value > 0.05) the experimental data and errors of the experiments were low. The values of R2 and adj R2 were 0.9864 and 0.9742, respectively, demonstrating that the results of the model were fitted to the experimental results. Finally, these relations showed that this model was significant. To investigate the effects of variables, all experiments were carried out in various combinations of the variables; they were statistically designed using central composite design (CCD). To access a final model with significant predictors, insignificant (p-value > 0.05) interactions were eliminated from this model. Thus, other significant variables were retained in the final regression model. So, the following equation was derived as the final equation using coefficient of the coded variables for removal of MC-LR (Eq. 4):
Removal of MC−LR (%) = 76.05 - 5.44 A + 3.94 B + 7.48 C - 1.16 BC + 3.38 A2 + 1.02 C2 (4)
Table 3: Experimental design conditions and responses of various experimental run
| MC-LR removal (%) | Variables | Run. no | |||
| Predicted | Actual | C: Catalyst dose (g/l) | B: Contact time (min) | A: pH | |
| 89.42 | 90.70 | 1 | 10 | 5 | 1 |
| 79.99 | 78.60 | 1 | 10 | 9 | 2 |
| 85.03 | 85.10 | 1 | 30 | 9 | 3 |
| 73.05 | 73.40 | 0.4 | 10 | 5 | 4 |
| 95.50 | 95.10 | 1 | 30 | 5 | 5 |
| 76.05 | 75.42 | 0.7 | 20 | 7 | 6 |
| 76.05 | 77.35 | 0.7 | 20 | 7 | 7 |
| 76.05 | 76.37 | 0.7 | 20 | 7 | 8 |
| 67.00 | 65.80 | 0.24 | 20 | 7 | 9 |
| 81.02 | 80.80 | 0.7 | 35.25 | 7 | 10 |
| 83.79 | 85.60 | 0.4 | 30 | 5 | 11 |
| 61.78 | 62.60 | 0.4 | 10 | 9 | 12 |
| 71.46 | 70.60 | 0.4 | 30 | 9 | 13 |
| 76.05 | 74.99 | 0.7 | 20 | 7 | 14 |
| 76.05 | 75.53 | 0.7 | 20 | 7 | 15 |
| 76.05 | 77.10 | 0.7 | 20 | 7 | 16 |
| 75.62 | 76.70 | 0.7 | 20 | 10 | 17 |
| 69.00 | 68.50 | 0.7 | 4.75 | 7 | 18 |
| 92.20 | 90.40 | 0.7 | 20 | 4 | 19 |
| 89.82 | 90.30 | 1.16 | 20 | 7 | 20 |
Table 4: The results of analysis of variance in removing MC-LR
| p value Prob > F | F Value | Mean Square | df | Sum of Squares | Source |
| < 0.0001 | 80.78 | 158.78 | 9 | 1429.02 | Model |
| < 0.0001 | 190.3 | 274.08 | 1 | 374.08 | A: pH |
| < 0.0001 | 99.96 | 196.48 | 1 | 196.48 | B: Contact time |
| < 0.0001 | 360.33 | 708.3 | 1 | 708.3 | C: Catalyst dose |
| 0.6068 | 0.28 | 0.55 | 1 | 0.55 | AB |
| 0.3728 | 0.87 | 1.71 | 1 | 1.71 | AC |
| 0.0410 | 5.50 | 10.81 | 1 | 10.81 | BC |
| < 0.0001 | 62.96 | 123.75 | 1 | 123.75 | A2 |
| 0.3216 | 1.09 | 2.14 | 1 | 2.14 | B2 |
| 0.0382 | 5.70 | 11.20 | 1 | 11.20 | C2 |
| 1.97 | 10 | 19.66 | Residual | ||
| 0.1122* | 3.23 | 3.00 | 5 | 15.01 | Lack of Fit |
| 0.93 | 5 | 4.65 | Pure Error | ||
| 19 | 1448.68 | Cor. Total |
Std. Dev.: 1.40; Mean: 78.55; C.V. %: 1.78; PRESS: 136.74; R2 : 0.9864; Adj R2 : 0.9742; Pred R2 : 0.9056;
Adeq. Precision: 34.08.
*not significant
Adeq. Precision: 34.08.
*not significant
The correlation between actual, predicted, and normal graphs of the residuals in removing MC-LR are presented in Figures 3a and b. According to these figures, data distribution shows a straight line, which indicates that the experimental data are fitted by the response predicted values.
Figure 3: Model evaluation plots for the removal of MC-LR by TiO2: the experimental data vs. the predicted value plot (a); the normalized residual plot (b)
Discussion
Effect of variables on photocatalytic degradation of MC-LR
Effect of single factors
Among the pH, contact time, and catalyst dose variables, factors with high mean square and high F-value had the highest effect on the photodegradation of MC-LR by TiO2. So, Catalyst dose (c) with mean square = 703.3 and F-value = 360.3 were the most important parameters in MC-LR removal. Moreover, the pH and contact time variables had lower importance than catalyst dose in MC-LR degradation.
Effect of pH
The effect of pH on the removal of MC-LR at various ranges of pH is presented in Figure 4a. This figure shows that the pH variable has a negative effect on MC-LR removal. So, the degradation rate of MC-LR increased with decrease of the pH. Therefore, the results indicated that MC-LR removal had increased in the acidic range. Generally, in photocatalytic systems, the acidic range was determined considering the strong electrostatic adsorption between the positive charges of catalyst and the negative charges of toxin were determined as the optimal pH in photocatalytic degradation of toxins. So, the forces between the catalyst particles and MC-LR molecules were attractive forces resulting in high photodegradation 42. Samy et al. reported that the photocatalytic degradation of chlorpyrifos was increased in the acidic pH due to the effect of attractive forces between the catalyst particles and chlorpyrifos molecules 46. In addition, other similar studies showed that the removal efficiency of direct red 16 (DR16), methylene blue, and Acid Blue 113 dyes was decreased in alkaline pH. In acidic pH, photocatalytic activity was improved by electrostatic force interactions between dye molecules and surface of the catalyst 47-49. Fakhravar et al. reported that the degradation rate of Metronidazole increased with decrease of the initial pH 50.
Effect of irradiation time
Figure 4b demonstrates the effect of contact times on the removal efficiency of MC-LR using TiO2 photocatalysts. The results indicated a positive relationship between contact time and MC-LR degradation. In other words, increase of the contact time enhances the MC-LR removal efficiency because increase of the contact time enhances the reaction time, and increases probability of the interaction between MC-LR and electron-hole pair subsequently. Rahimi et al. showed that degradation rate of acid orange 10 increased by increase of the contact time. In other words, when the contact time increased from the start of the process to 150 min, the removal efficiency reached from 0 to 94% 41. Similar studies by Sheikh Asadi et al. and Rafiee et al. reported that enhancing the contact time increased the removal efficiency of Bisphenol A and DR16 dye, respectively. This is due to the fact that increased contact time enhanced the photocatalytic activities in the catalyst surface 51, 52.
Effect of catalyst dose
The effect of the TiO2 catalyst dose on the removal efficiency of MC-LR is represented in Figure 4c. This figure shows that the degradation rate of MC-LR increases with increasing TiO2 catalyst dose because the active sites of catalysts rise and cause absorption of MC-LR and light, which increase the photocatalytic degradation consequently. Zhang et al. reported that degradation rate of the MC-LR enhanced with the increase of catalyst dose due to the surface area of the catalyst 53. Koh et al. and Arabzadeh et al. reported that the photodegradation rate of Methylene Blue (MB) and tartrazine enhanced when the catalyst dose increased, respectively. Increase of the catalyst dose can enhance the photocatalytic active sites to absorb more photons. This generates more hydroxyl and superoxide radicals and finally degrades more pollutant molecules 54, 55. Therefore, given the cost and effects of the catalyst, choosing the optimum catalyst dose is very indispensable.
Figure 4: The effect of pH (a), contact time (b) and catalyst dose (c) on MC-LR degradation (%)
Interaction relationship between studied variables
Figure 5 illustrates the effects of interactions between different variables in the MC-LR degradation (%) by the 3D-dimensional surface-response plots gained from the quadratic model. Figure 5a shows the 3-D response surface plot of the MC-LR removal efficiency in various contact times vs. pH. According to this figure, a decrease in pH and an increase in contact time, increased the removal efficiency of MC-LR. The effect of the pH on MC-LR degradation in this figure is more evident than the contact time. However, ANOVA results showed that P-value of the interaction effect coefficients of the contact time and pH was equal to 0.6068, which is not significant. The interaction effect between catalyst dose and pH in the MC-LR degradation (%) is illustrated in Figure 5b. As it shows, increase of the catalyst dose and reduction of the pH boost the MC-LR removal efficiency. However, the ANOVA results indicated that interaction effect coefficients of the catalyst dose and pH were not significant (P-value = 0.3728) and did not display any interaction effects. Figure 5c shows that the catalyst dose and contact time had a positive effect on the removal efficiency of MC-LR. This means that the catalyst dose and contact time display interaction effects on MC-LR removal. Moreover, the ANOVA results approved that interaction effect coefficients of these two parameters were significant (P-value = 0.0410).
Figure 5 illustrates the effects of interactions between different variables in the MC-LR degradation (%) by the 3D-dimensional surface-response plots gained from the quadratic model. Figure 5a shows the 3-D response surface plot of the MC-LR removal efficiency in various contact times vs. pH. According to this figure, a decrease in pH and an increase in contact time, increased the removal efficiency of MC-LR. The effect of the pH on MC-LR degradation in this figure is more evident than the contact time. However, ANOVA results showed that P-value of the interaction effect coefficients of the contact time and pH was equal to 0.6068, which is not significant. The interaction effect between catalyst dose and pH in the MC-LR degradation (%) is illustrated in Figure 5b. As it shows, increase of the catalyst dose and reduction of the pH boost the MC-LR removal efficiency. However, the ANOVA results indicated that interaction effect coefficients of the catalyst dose and pH were not significant (P-value = 0.3728) and did not display any interaction effects. Figure 5c shows that the catalyst dose and contact time had a positive effect on the removal efficiency of MC-LR. This means that the catalyst dose and contact time display interaction effects on MC-LR removal. Moreover, the ANOVA results approved that interaction effect coefficients of these two parameters were significant (P-value = 0.0410).
Figure 5: Interaction between different variables: (a) Contact time vs. pH; (b) Catalyst dose vs. pH; (c) Catalyst dose vs. Contact time in the MC-LR degradation (%)
Optimization of various process parameters
The optimum amount of various variables including pH (A), contact time (B), and catalyst dose (C) in the removal of MC-LR were optimized by the RSM model. The desirable goal in the RSM model was set on the maximum removal percentage of MC-LR. So, the highest MC-LR removal efficiency was about 95.1% at these conditions: pH = 5, contact time = 30 min and catalyst dose = 1 g/l. Finally, in order to estimate the validity of optimal conditions in the removal of MC-LR, a series of experiments were performed. The findings showed a good accordance between these results and predictions of Design Expert.
Photocatalytic mechanism
TiO2 absorbed photons, was excited, and generated e− and h+ pairs 56. The photodegradation reactions are occurring in the presence of ultraviolet (UV) light source. Initially, a photon is absorbed by the photocatalyst after irradiating the UV light. This causes charge separation and excites an e− to the conduction band (CB) of the catalyst. As a result, •OH is generated by oxidation of H2O molecules with photogenerated holes and oxygenated species that attack the MC-LR molecules. The generated e− by photon absorption, either react with oxygen absorbed on the catalyst surface or react with H2O to produce •O2− radicals or it may reduce the MC-LR (Figure 6). The hole (h+) is responsible for generating •OH radicals by reacting with OH ions or H2O 35, 57, 58. When •OH radical is formed, it reacts instantly 59. The probable photochemical reactions in the degradation of MC-LR by TiO2 are presented as follows:
TiO2 + hν→ h+ + e−
TiO2 (h+) + H2O → •OH
TiO2 (e−) + O2 →•O2−
•O2− + H2O → •OH
MC-LR + •OH (and/or) •O2− → degradation product
Figure 6: Degradation mechanism of MC-LR.
Conclusions
The results showed that increased contact time and catalyst dose as well as reduction of pH boosted the removal efficiency of MC-LR. According to the results, the highest removal efficiency of MC-LR was 95.1% that was observed in pH = 5, contact time = 30 min, and catalyst
dose = 1 g/l. According to the findings, TiO2, as a common photocatalyst had a suitable effect on degradation of MC-LR. However, we suggest combining TiO2 with metal and non-metallic semiconductors to increase the removal efficiency of MC-LR. Moreover, it can be concluded that RSM is one of the efficient methods for decreasing costs and the number of experiments.
Funding
This study is a part of a Ph.D. thesis (No. 395847) performed in Isfahan University of Medical Sciences, Iran. The authors appreciate the Department of environmental Health Engineering and Environment Research Center for funding this research.
Conflict of interest
Authors declare no conflict of interest.
This is an Open Access article distributed in accordance with the terms of the Creative Commons Attribution (CC BY 4.0) license, which permits others to distribute, remix, adapt and build upon this work for commercial use.
References
- Kahru M, Elmgren R, Kaiser J, et al. Cyanobacterial blooms in the Baltic Sea: correlations with environmental factors. Harmful Algae. 2020;92:101739.
- Sòria-Perpinyà X, Vicente E, Urrego P, et al. Remote sensing of cyanobacterial blooms in a hypertrophic lagoon (Albufera of València, Eastern Iberian Peninsula) using multitemporal Sentinel-2 images. Sci Total Environ. 2020;698: 134305.
- Graham JL, Loftin KA, Meyer MT, et al. Cyanotoxin mixtures and taste-and-odor compounds in cyanobacterial blooms from the Midwestern United States. Environ. Sci Technol. 2010;44(19):7361-8.
- Wang K, Razzano M, Mou X. Cyanobacterial blooms alter the relative importance of neutral and selective processes in assembling freshwater bacterioplankton community. Sci Total Environ. 2020;706:135724.
- Newell SE, Davis TW, Johengen TH, et al. Reduced forms of nitrogen are a driver of non-nitrogen-fixing harmful cyanobacterial blooms and toxicity in Lake Erie. Harmful Algae. 2019;81:86-93.
- Zamyadi A, Sawade E, Ho L, et al. Impact of UV–H2O2 advanced oxidation and aging processes on GAC capacity for the removal of cyanobacterial taste and odor compounds. Environ Health Insights. 2020;9(s3).
- Huisman J, Codd GA, Paerl HW, et al. Cyanobacterial blooms. Nat Rev Microbiol. 2018;16(8):471-83.
- Kutser T, Metsamaa L, Strömbeck N, et al. Monitoring cyanobacterial blooms by satellite remote sensing. Estuar Coast Shelf S. 2006;67(1-2):303-12.
- Merel S, Walker D, Chicana R, et al. State of knowledge and concerns on cyanobacterial blooms and cyanotoxins. Environ Int. 2013;59: 303-27.
- 10.Zhang G, Zhang YC, Nadagouda M, et al. Visible light-sensitized S, N and C co-doped polymorphic TiO2 for photocatalytic destruction of microcystin-LR. Appl Catal B-Environ. 2014;144:614-21.
- Zhao C, Shao N, Yang S, et al. Predicting cyanobacteria bloom occurrence in lakes and reservoirs before blooms occur. Sci Total Environ. 2019;670:837-48.
- Chintalapati P, Mohseni M. Degradation of cyanotoxin microcystin-LR in synthetic and natural waters by chemical-free UV/VUV radiation. J Hazard Mater. 2020;381:120921.
- Yang F, Huang F, Feng H, et al. A complete route for biodegradation of potentially carcinogenic cyanotoxin microcystin-LR in a novel indigenous bacterium. Water Res. 2020;174: 115638.
- Fuhar D, Benoit B, Madjid M. Removal of Microcystin-LR from spiked natural and synthetic waters by anion exchange. Sci Total Environ. 2019;655:571-80.
- Lin W, Guo H, Wang L, et al. Waterborne microcystin-LR exposure induced chronic inflammatory response via MyD88-dependent toll-like receptor signaling pathway in male zebrafish. Sci Total Environ. 2020;702:
134969. - Nawaz M, Moztahida M, Kim J, et al. Photodegradation of microcystin-LR using graphene-TiO2/sodium alginate aerogels. Carbohydr Polym. 2018;199:109-18.
- Zhan C, Liu W, Zhang F, et al. Microcystin-LR triggers different endoplasmic reticulum stress pathways in the liver, ovary, and offspring of zebrafish (Danio rerio). J Hazard Mater. 2020;386:121939.
- Antoniou MG, Boraei I, Solakidou M, et al. Enhancing photocatalytic degradation of the cyanotoxin microcystin-LR with the addition of sulfate-radical generating oxidants. J Hazard Mater. 2018;360:461-70.
- WHO, Cyanobacterial Toxins: Microcystin-LR Guidelines for Drinking Water Quality, 2nd ed. 1998, World Health Organization Press: Geneva, Switzerland.
- Choi H, Antoniou MG, Pelaez M, et al. Mesoporous nitrogen-doped TiO2 for the photocatalytic destruction of the cyanobacterial toxin microcystin-LR under visible light irradiation. Environ Sci Technol. 2007;41(21): 7530-5.
- Sun J, Bu L, Deng L, et al. Removal of Microcystis aeruginosa by UV/chlorine process: Inactivation mechanism and microcystins degradation. Chem Eng. 2018;349:408-15.
- Wu P, Li G, He Y, et al. High-efficient and sustainable biodegradation of microcystin-LR using Sphingopyxis sp. YF1 immobilized Fe3O4@ chitosan. Colloids Surf B Biointerfaces. 2020;185:110633.
- Liu G, hang G, Zhang S, et al. Degradation and mechanism of microcystin-LR by PbCrO4 nanorods driven by visible light. Chemosphere. 2020;239:124739.
- Park JA, Yang B, Jang M, et al. Oxidation and molecular properties of microcystin-LR, microcystin-RR and anatoxin-a using UV-light-emitting diodes at 255 nm in combination with H2O2. Chem Eng. 2019;366:423-32.
- Xia D, M C Lo I. Synthesis of magnetically separable Bi2O4/Fe3O4 hybrid nanocomposites with enhanced photocatalytic removal of ibuprofen under visible light irradiation. Water Res. 2016;100:393-404.
- Kanigaridou Y, Petala A, Frontistis Z, et al. Solar photocatalytic degradation of bisphenol A with CuOx/BiVO4: insights into the unexpectedly favorable effect of bicarbonates. Chem Eng. 2017;318:39-49.
- Loaiza-González JM, León-Salazar MC, Rubio-Clemente A, et al. Efficiency of the removal of microcystin-LR by UV-radiation and hydrogen peroxide. Revista Facultad de Ingeniería Universidad de Antioquia. 2020(95): 9-19.
- Serrà A, Pip P, Gómez E, et al. Efficient magnetic hybrid ZnO-based photocatalysts for visible-light-driven removal of toxic cyanobacteria blooms and cyanotoxins. Appl Catal B-Environ. 2020;268:118745.
- Dadvar E, Kalantary RR, Ahmad Panahi H, et al. Efficiency of polymeric membrane graphene oxide-TiO2 for removal of azo dye. J Chem. 2017;2017(5):13.
- Liu I, Lawton LA, Bahnemann DW, et al. The photocatalytic destruction of the cyanotoxin, nodularin using TiO2. Appl Catal B-Environ. 2005;60(3-4):245-52.
- Tryba B, Morawski A,Inagaki M. Application of TiO2-mounted activated carbon to the removal of phenol from water. Appl Catal B-Environ. 2003;41(4):427-33.
- Yang J-K, Lee S-M. Removal of Cr (VI) and humic acid by using TiO2 photocatalysis. Chemosphere. 2006;63(10):1677-84.
- PetalaA, Noe A, Frontistis Z, et al. Synthesis and characterization of CoOx/BiVO4 photocatalysts for the degradation of propyl paraben. J Hazard Mater. 2019;372:52-60.
- Khadgi N, Upreti AR. Photocatalytic degradation of Microcystin-LR by visiblelight active and magnetic, ZnFe2O4-Ag/rGO nanocomposite and toxicity assessment of the intermediates. Chemosphere. 2019; 221: 441-51.
- Diaz-Angulo J, Lara-Ramos J, Mueses M, et al. Enhancement of the oxidative removal of diclofenac and of the TiO2 rate of photon absorption in dye-sensitized solar pilot scale CPC photocatalytic reactors. Chem Eng. 2020;381:122520.
- Wang H, Huang X, Li W, et al. TiO2 nanoparticle decorated carbon nanofibers for removal of organic dyes. Colloid Surf A Physicochem Eng. 2018;549:205-11.
- WangX, Yu J, Sun G, et al. Electrospun nanofibrous materials: a versatile medium for effective oil/water separation. Mater today. 2016;19(7):403-14.
- Faraji M, Ebrahimi A, Nourmoradi H, et al. Optimizing the removal of humic acid with polyaluminum chloride and polyaluminum ferric chloride as green coagulants using response surface methodology. Desalination Water Treat. 2019:297-304.
- Mohammadi A, Nemati S, Mosaferi M, et al. Predicting the capability of carboxymethyl cellulose-stabilized iron nanoparticles for the remediation of arsenite from water using the response surface methodology (RSM) model: modeling and optimization. J Contam Hydrol. 2017;203:85-92.
- Rahimi B, Ebrahimi A. Photocatalytic process for total arsenic removal using an innovative BiVO4/TiO2/LED system from aqueous solution: Optimization by response surface methodology (RSM). J Taiwan Inst Chem Eng. 2019;101:64-79.
- Rahimi B, Jafari N, Abdolahnejad A, et al. Application of efficient photocatalytic process using a novel BiVO4/TiO2-NaY zeolite composite for removal of acid orange 10 dye in aqueous solutions: Modeling by response surface methodology (RSM). J Environ Chem Eng. 2019;7(4):103253.
- Jafari N, Ebrahimpour K, Abdolahnejad A, et al. Efficient degradation of microcystin-LR by BiVO4/TiO2 photocatalytic nanocomposite under visible light. J Environ Health. 2019;17(2):1171-83.
- Jiang P, Ren D, He D, et al. An easily sedimentable and effective TiO2 photocatalyst for removal of dyes in water. Sep Purif Technol. 2014;122:128-32.
- Li J, Feng J, Yan W. Excellent adsorption and desorption characteristics of polypyrrole/ TiO2 composite for Methylene Blue. Appl Surf Sci. 2013;279:400-8.
- Wu J, Lü X, Zhang L, et al. Crystallinity control on photocatalysis and photoluminescence of TiO2-based nanoparticles. J Alloy Compd. 2010;496(1-2):234-40.
- Samy M, Ibrahim MG, Alalm MG, et al. Innovative photocatalytic reactor for the degradation of chlorpyrifos using a coated composite of ZrV2O7 and graphene nano-platelets. Chem Eng. 2020;395:124974.
- Mortazavian S, Saber A, James DE. Optimization of photocatalytic degradation of Acid Blue 113 and Acid Red 88 textile dyes in a UV-C/TiO2 suspension system: application of response surface methodology (RSM). Catalysts. 2019;9(4):360.
- Zangeneh H, Farhadian M, Zinatizadeh A. N (Urea) and CN (L-Asparagine) doped TiO2-CuO nanocomposites: Fabrication, characterization and photodegradation of direct red 16. J Environ Chem Eng. 2020;8(1):103639.
- Zangeneh H, Zinatizadeh AA, Zinadini S, et al. A novel L-Histidine (C, N) codoped- TiO2-CdS nanocomposite for efficient visible photo-degradation of recalcitrant compounds from wastewater. J Hazard Mater. 2019;369:384-97.
- Fakhravar S, Farhadian M, Tangestaninejad S. Metronidazole degradation by Z-scheme Ag2S/BiVO4@ α-Al2O3 heterojunction in continuous photo-reactor: response surface methodology optimization, reaction mechanism and the effect of water matrix. J Environ Chem Eng. 2020;8(5):104136.
- Asadi AMS, Malakootian M, Kowsari E, et al. Ionic liquid-assisted sol-gel synthesis of Fe2O3-TiO2 for enhanced photocatalytic degradation of bisphenol a under UV illumination: Modeling and optimization using response surface methodology. Optik. 2020; 204: 164229.
- Rafiee E, Noori E, Zinatizadeh AA, et al. Surfactant effect on photocatalytic activity of Ag-TiO2/PW nanocomposite in DR16 degradation: characterization of nanocomposite and RSM process optimization. Mater Sci Semicond Process. 2018;83:115-24.
- Zhang H, Zhu G, Jia X, et al. Removal of microcystin-LR from drinking water using a bamboo-based charcoal adsorbent modified with chitosan. J Environ Sci. 2011;23(12):1983-8.
- Arabzadeh N, Mohammadi A, Darwish M, et al. Construction of a TiO2–Fe3O4‐decorated molecularly imprinted polymer nanocomposite for tartrazine degradation: Response surface methodology modeling and optimization. J Chin Chem Soc. 2019;66(5):474-83.
- Koh P, Yuliati L, Lee S. Kinetics and optimization studies of photocatalytic degradation of methylene Blue over Cr-Doped TiO2 using response surface methodology. Iran J Sci Technol A. 2019;43(1):95-103.
- Tu L, Hou Y, Yuan G, et al. Bio-photoelectrochemcial system constructed with BiVO4/ RGO photocathode for 2, 4-dichlorophenol degradation: BiVO4/RGO optimization, degradation performance and mechanism. J Hazard Mater. 2020;389:121917.
- Khedr TM, El-Sheikh SM, Ismail AA, et al. Photodegradation of microcystin-LR using visible light-activated C/N- co- modified mesoporous TiO2 photocatalyst. J Hazard Mater. 2019;12(7):1027.
- Pinho LX, Azevedo J, Brito Â, et al. Effect of TiO2 photocatalysis on the destruction of microcystis aeruginosa cells and degradation of cyanotoxins microcystin- LR and cylindrospermopsin. Chem Eng. 2015;268:144-52.
- Khan SB, Hou M, Shuang S, et al. Morphological influence of TiO2 nanostructures (nanozigzag, nanohelics and nanorod) on photocatalytic degradation of organic dyes. Appl Surf Sci. 2017;400:184-93.
Type of Study: Original articles |
Subject:
Water quality and wastewater treatment and reuse
Received: 2020/05/21 | Accepted: 2020/07/10 | Published: 2020/09/27
Received: 2020/05/21 | Accepted: 2020/07/10 | Published: 2020/09/27
Send email to the article author
| Rights and permissions | |
 |
This work is licensed under a Creative Commons Attribution-NonCommercial 4.0 International License. |
